Python Statistics Fundamentals: How to Describe Your Data Quiz
Interactive Quiz ⋅ 13 Questions
By Joseph Peart
In this quiz, you’ll test your understanding of Python Statistics Fundamentals: How to Describe Your Data.
By working through these questions, you’ll revisit the numerical quantities that describe and summarize a dataset, including the measures of central tendency, variability, and correlation.
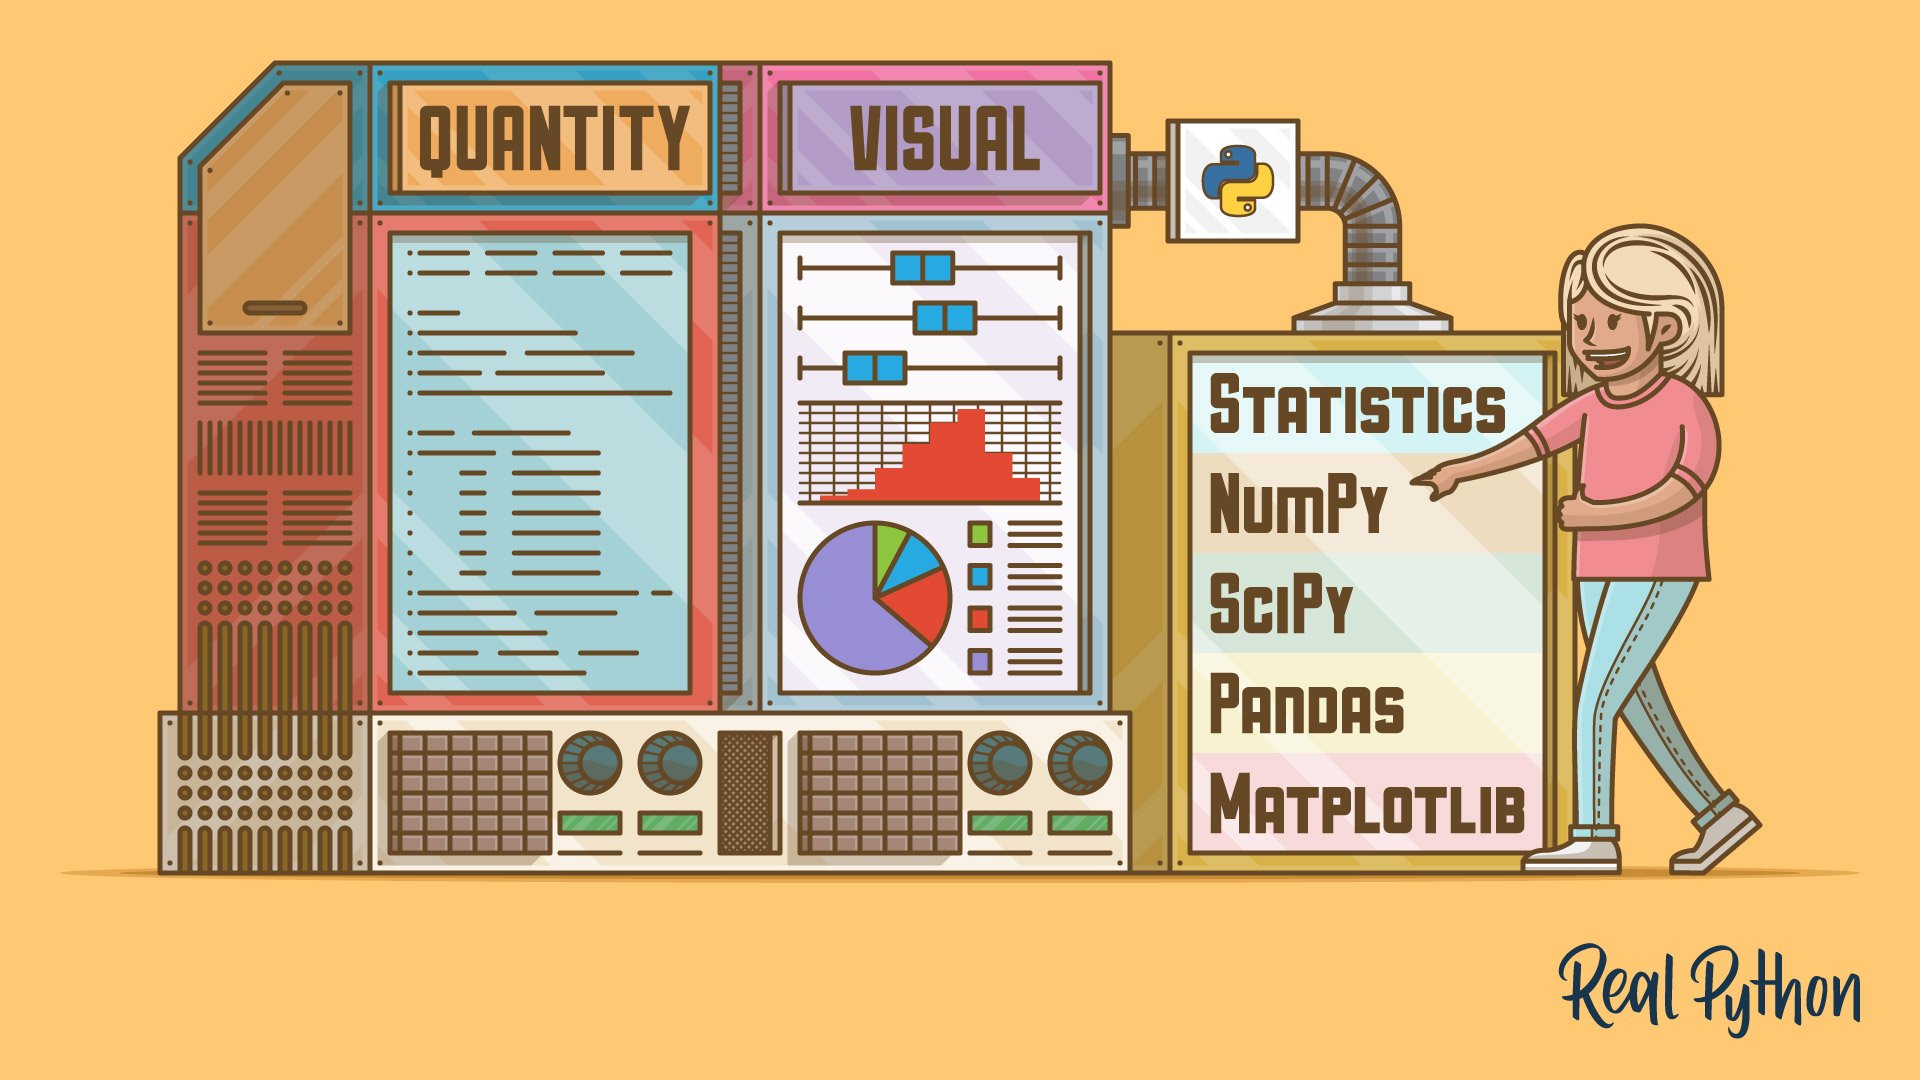
You’ll also revisit how to calculate them with the built-in statistics module, how NumPy, SciPy, and pandas take over as your data grows, and how plots make those numbers easier to read.
The quiz contains 13 questions and there is no time limit. You’ll get 1 point for each correct answer. At the end of the quiz, you’ll receive a total score. The maximum score is 100%. Good luck!
Related Resources
Tutorial
Python Statistics Fundamentals: How to Describe Your Data
Calculate descriptive Python statistics and visualize your data using NumPy, SciPy, pandas, Matplotlib, and the built-in statistics library.
