Polars Cheat Sheet
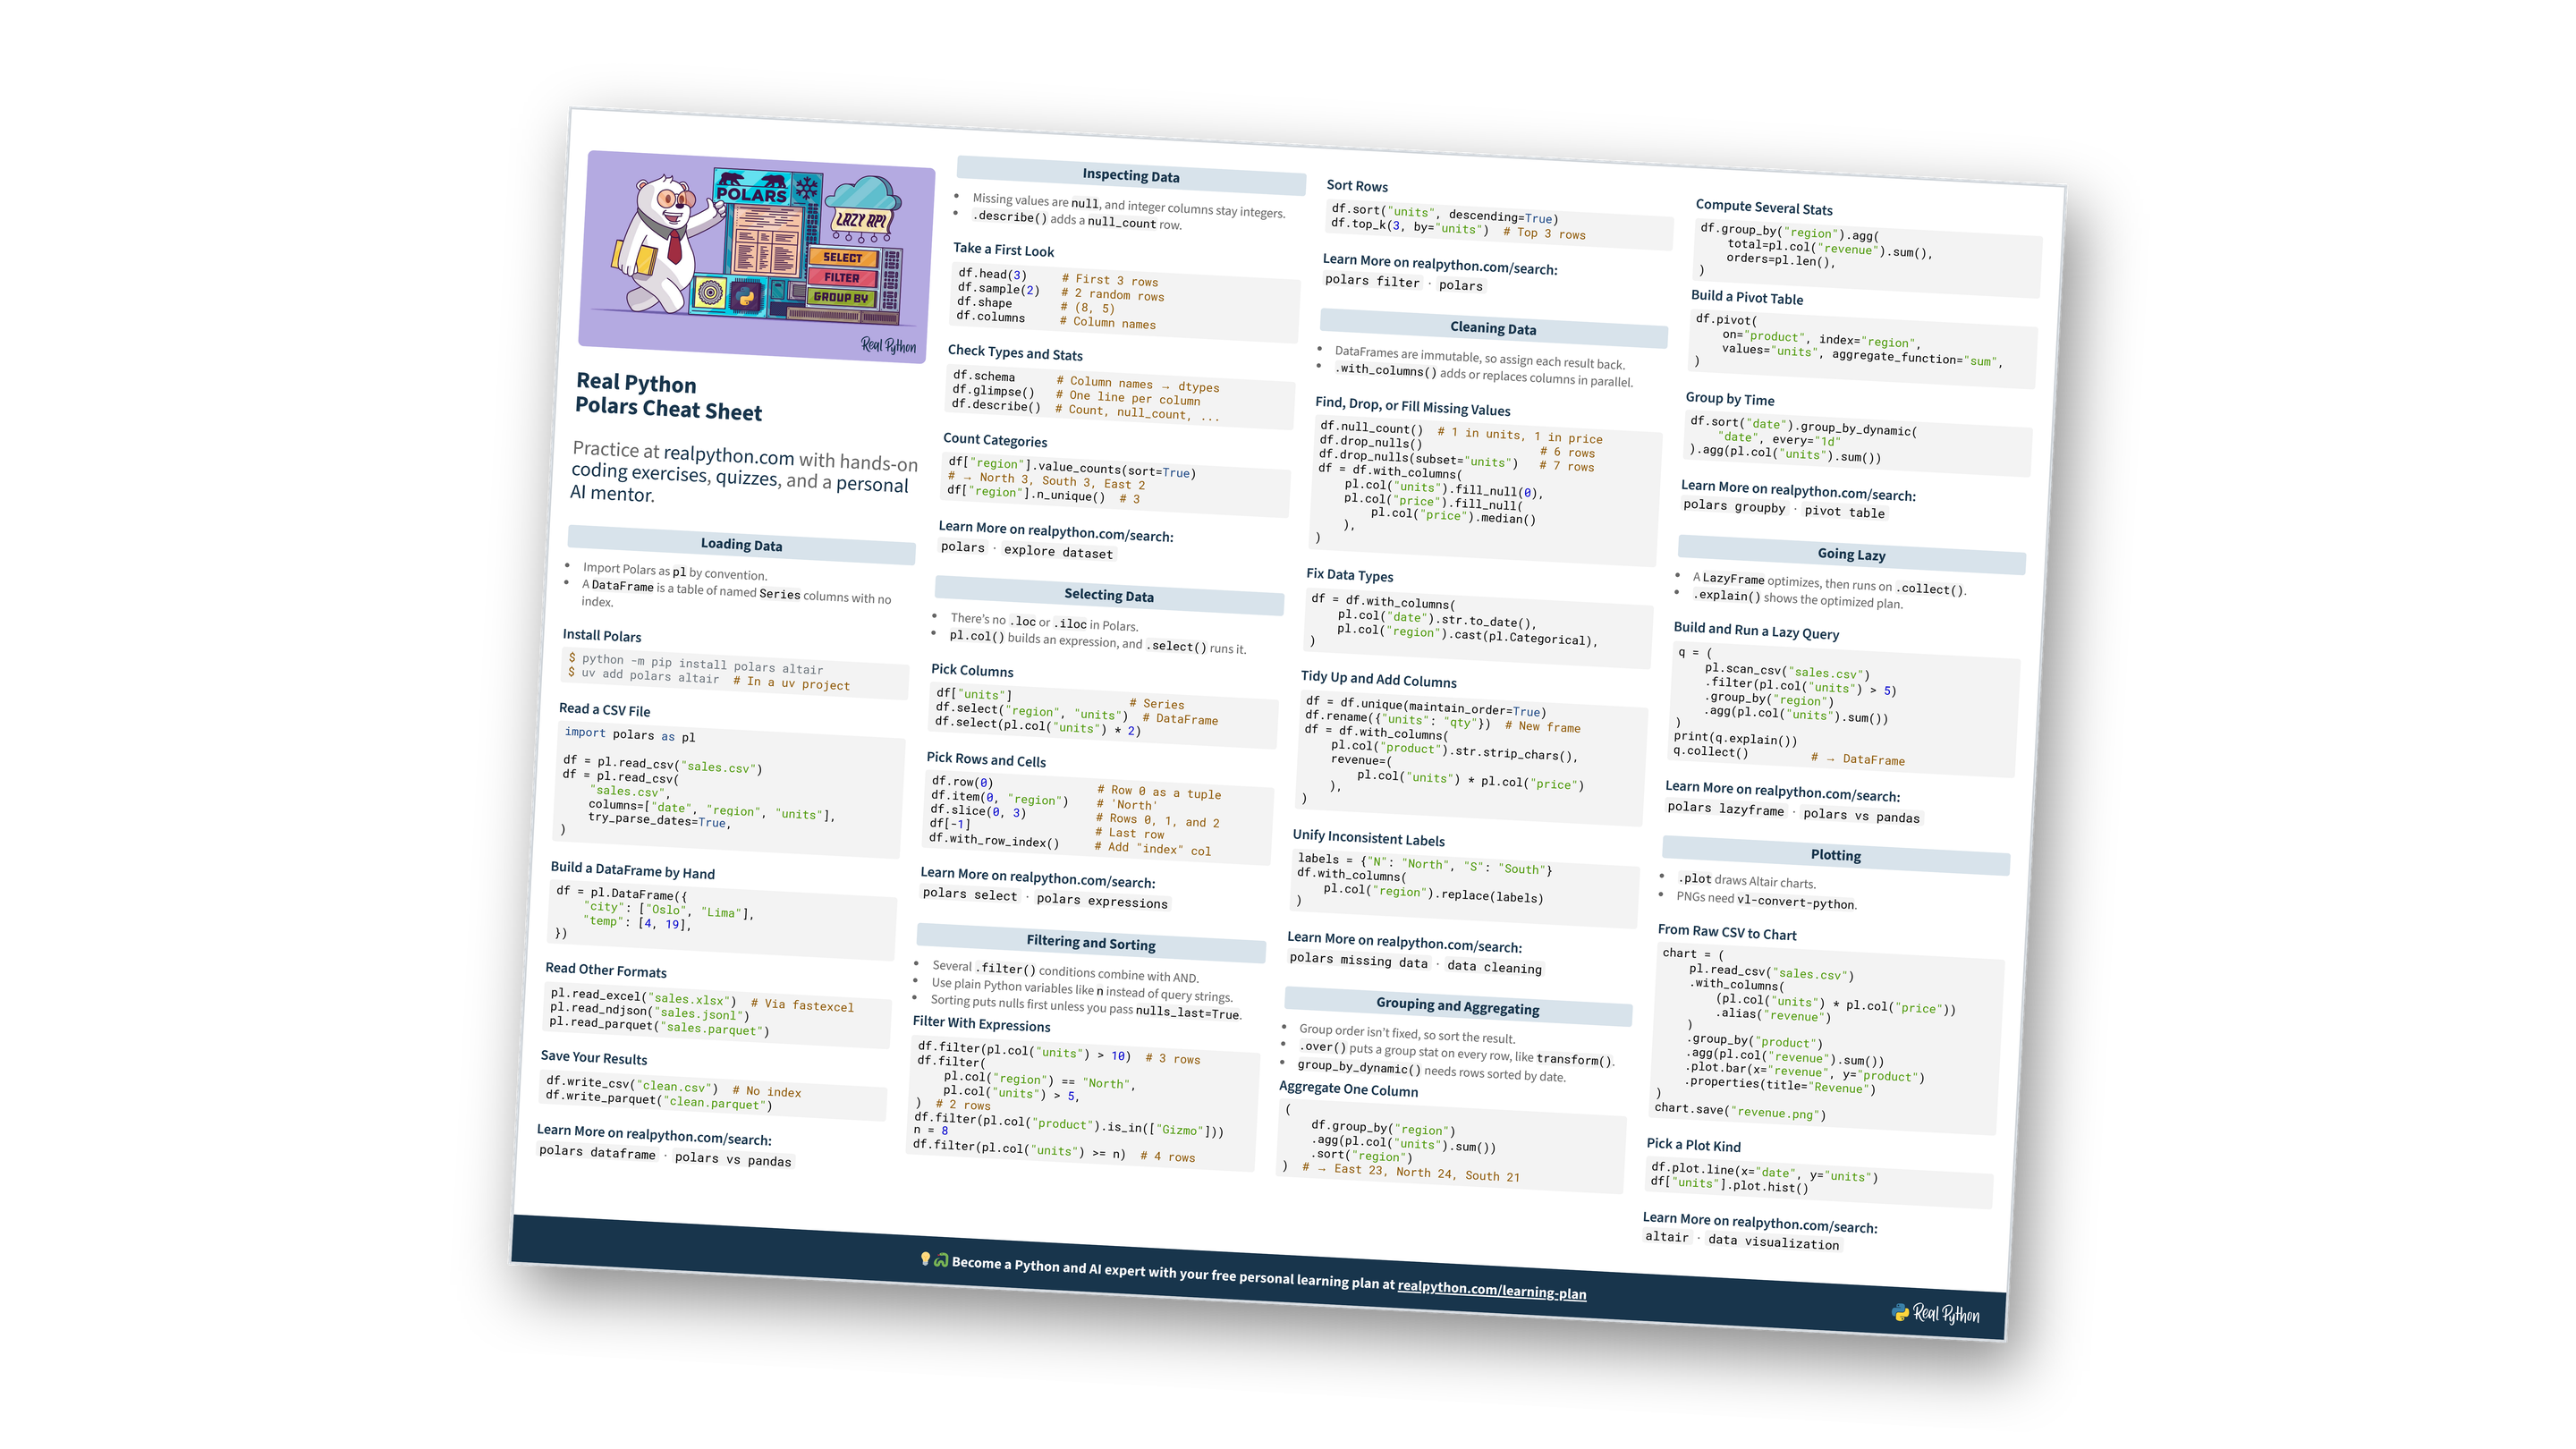
This Python Polars cheat sheet is a condensed overview of the Polars syntax you’ll use most. It covers loading and inspecting a Polars DataFrame, selecting, filtering, cleaning, Polars group by aggregations, the Polars LazyFrame, and plotting. The free download includes both the compact one-page cheat sheet and a detailed five-page edition. You can also download the information as a printable cheat sheet:
Free Bonus: Polars Cheat Sheets
Get two Polars cheat sheet PDFs, a compact one-pager and a detailed five-page edition, with the expressions, group by, and lazy API syntax you'll reach for most:
Practice with hands-on coding exercises, quizzes, and a personal AI mentor. Not sure what to learn next? Get your free personal learning plan.
New to Polars?
Loading Data
- Import Polars as
plby convention. - A
DataFrameis a table of namedSeriescolumns with no index. - Coming from pandas? Expressions like
pl.col()replace.loc,.query(), andinplace=.
Install Polars
$ python -m pip install polars altair
$ uv add polars altair  # In a uv project
Read a CSV File
import polars as pl

df = pl.read_csv("sales.csv")
df = pl.read_csv(
    "sales.csv",
    columns=["date", "region", "units"],
    try_parse_dates=True,
)
Build a DataFrame by Hand
df = pl.DataFrame({
    "city": ["Oslo", "Lima"],
    "temp": [4, 19],
})
Read Other Formats
pl.read_excel("sales.xlsx")  # Via fastexcel
pl.read_ndjson("sales.jsonl")
pl.read_parquet("sales.parquet")
Save Your Results
df.write_csv("clean.csv")  # No index
df.write_parquet("clean.parquet")
Follow these guides to get started with Polars:
- Python Polars: A Lightning-Fast DataFrame Library
- Polars vs pandas: What’s the Difference?
- Video Course: Working With Python Polars
Coming from pandas?
Inspecting Data
- Missing values are
null, and integer columns stay integers. .describe()adds anull_countrow.
Take a First Look
df.head(3)     # First 3 rows
df.sample(2)   # 2 random rows
df.shape       # (8, 5)
df.columns     # Column names
Check Types and Stats
df.schema      # Column names → dtypes
df.glimpse()   # One line per column
df.describe()  # Count, null_count, ...
Count Categories
df["region"].value_counts(sort=True)
# → North 3, South 3, East 2
df["region"].n_unique()  # 3
Want to explore your own data?
Selecting Data
- There’s no
.locor.ilocin Polars. pl.col()builds an expression, and.select()runs it.
Pick Columns
df["units"]                 # Series
df.select("region", "units")  # DataFrame
df.select(pl.col("units") * 2)
Pick Rows and Cells
df.row(0)               # Row 0 as a tuple
df.item(0, "region")    # 'North'
df.slice(0, 3)          # Rows 0, 1, and 2
df[-1]                  # Last row
df.with_row_index()     # Add "index" col
Still thinking in .loc and .iloc?
Filtering and Sorting
- Several
.filter()conditions combine with AND. - Use plain Python variables like
ninstead of query strings. - Sorting puts nulls first unless you pass
nulls_last=True.
Filter With Expressions
df.filter(pl.col("units") > 10)  # 3 rows
df.filter(
    pl.col("region") == "North",
    pl.col("units") > 5,
)  # 2 rows
df.filter(pl.col("product").is_in(["Gizmo"]))
n = 8
df.filter(pl.col("units") >= n)  # 4 rows
Sort Rows
df.sort("units", descending=True)
df.top_k(3, by="units")  # Top 3 rows
Several conditions at once?
Free Bonus: Download both Polars cheat sheet PDFs, a compact one-pager and a detailed five-page edition, in one free bundle.
Cleaning Data
- DataFrames are immutable, so assign each result back.
.with_columns()adds or replaces columns in parallel.
Find, Drop, or Fill Missing Values
df.null_count()  # 1 in units, 1 in price
df.drop_nulls()                 # 6 rows
df.drop_nulls(subset="units")   # 7 rows
df = df.with_columns(
    pl.col("units").fill_null(0),
    pl.col("price").fill_null(
        pl.col("price").median()
    ),
)
Fix Data Types
df = df.with_columns(
    pl.col("date").str.to_date(),
    pl.col("region").cast(pl.Categorical),
)
Tidy Up and Add Columns
df = df.unique(maintain_order=True)
df.rename({"units": "qty"})  # New frame
df = df.with_columns(
    pl.col("product").str.strip_chars(),
    revenue=(
        pl.col("units") * pl.col("price")
    ),
)
Unify Inconsistent Labels
labels = {"N": "North", "S": "South"}
df.with_columns(
    pl.col("region").replace(labels)
)
Follow these guides to handle gaps in your data:
Think you’ve got cleaning down?
Grouping and Aggregating
- Group order isn’t fixed, so sort the result.
.over()puts a group stat on every row, liketransform().group_by_dynamic()needs rows sorted by date.
Aggregate One Column
(
    df.group_by("region")
    .agg(pl.col("units").sum())
    .sort("region")
)  # → East 23, North 24, South 21
Compute Several Stats
df.group_by("region").agg(
    total=pl.col("revenue").sum(),
    orders=pl.len(),
)
Build a Pivot Table
df.pivot(
    on="product", index="region",
    values="units", aggregate_function="sum",
)
Group by Time
df.sort("date").group_by_dynamic(
    "date", every="1d"
).agg(pl.col("units").sum())
Follow these guides to go deeper on grouping:
Ready to test your group by skills?
Going Lazy
- A
LazyFrameoptimizes, then runs on.collect(). .explain()shows the optimized plan.
Build and Run a Lazy Query
q = (
    pl.scan_csv("sales.csv")
    .filter(pl.col("units") > 5)
    .group_by("region")
    .agg(pl.col("units").sum())
)
print(q.explain())
q.collect()         # → DataFrame
Follow these guides to learn more about lazy queries:
Wondering what lazy buys you?
Plotting
.plotdraws Altair charts.- PNGs need
vl-convert-python.
From Raw CSV to Chart
chart = (
    pl.read_csv("sales.csv")
    .with_columns(
        (pl.col("units") * pl.col("price"))
        .alias("revenue")
    )
    .group_by("product")
    .agg(pl.col("revenue").sum())
    .plot.bar(x="revenue", y="product")
    .properties(title="Revenue")
)
chart.save("revenue.png")
Pick a Plot Kind
df.plot.line(x="date", y="units")
df["units"].plot.hist()
Want better charts?
Ready to go beyond the cheat sheet?
You can download this information as a printable cheat sheet:
Free Bonus: Polars Cheat Sheets
Get two Polars cheat sheet PDFs, a compact one-pager and a detailed five-page edition, with the expressions, group by, and lazy API syntax you'll reach for most:
