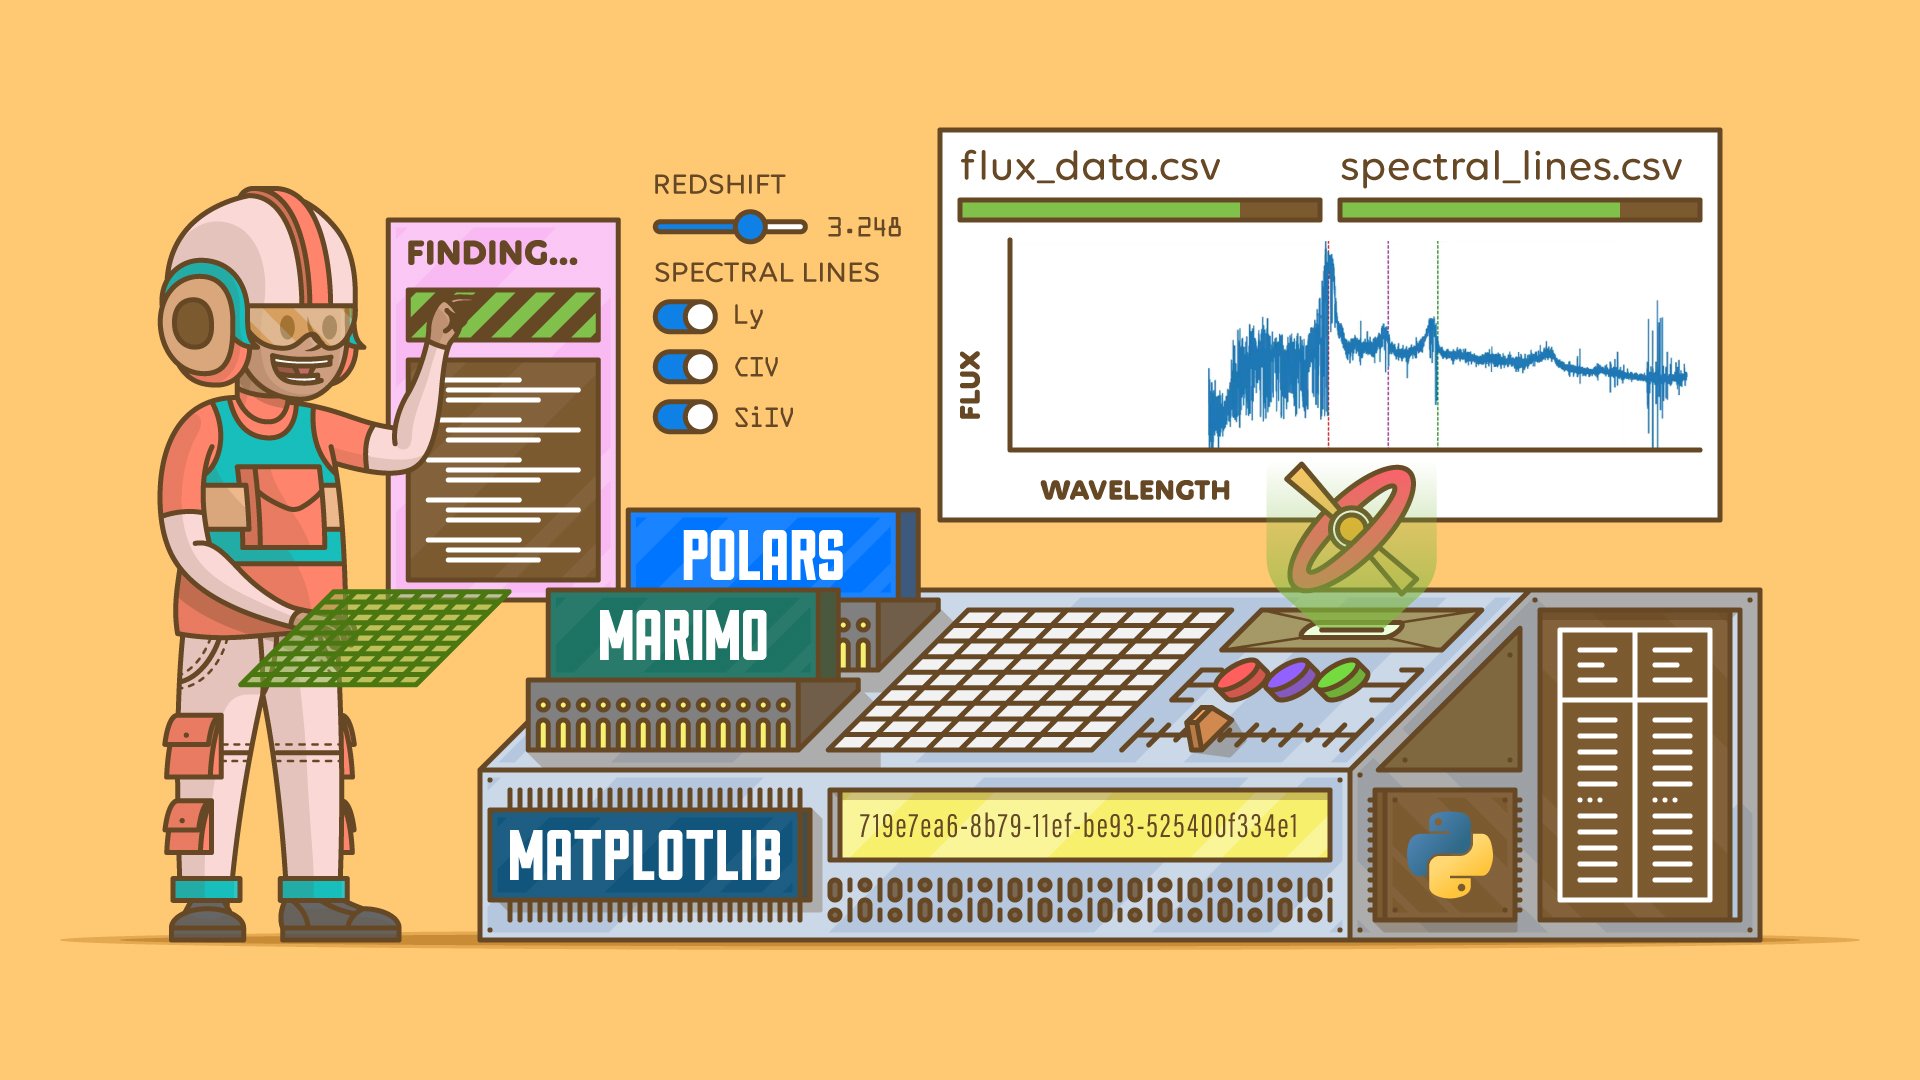
Learn to visualize quasar redshift data by building an interactive marimo dashboard using Polars, pandas, and Matplotlib. You’ll practice retrieving, cleaning, and displaying data in your notebook. You’ll also build interactive UI components that live-update visualizations in the notebook.
What’s Included:
- 10 Lessons
- Video Subtitles and Full Transcripts
- 2 Downloadable Resources
- Q&A With Python Experts: Ask a Question
- Certificate of Completion
Downloadable Resources:


