pandas Cheat Sheet
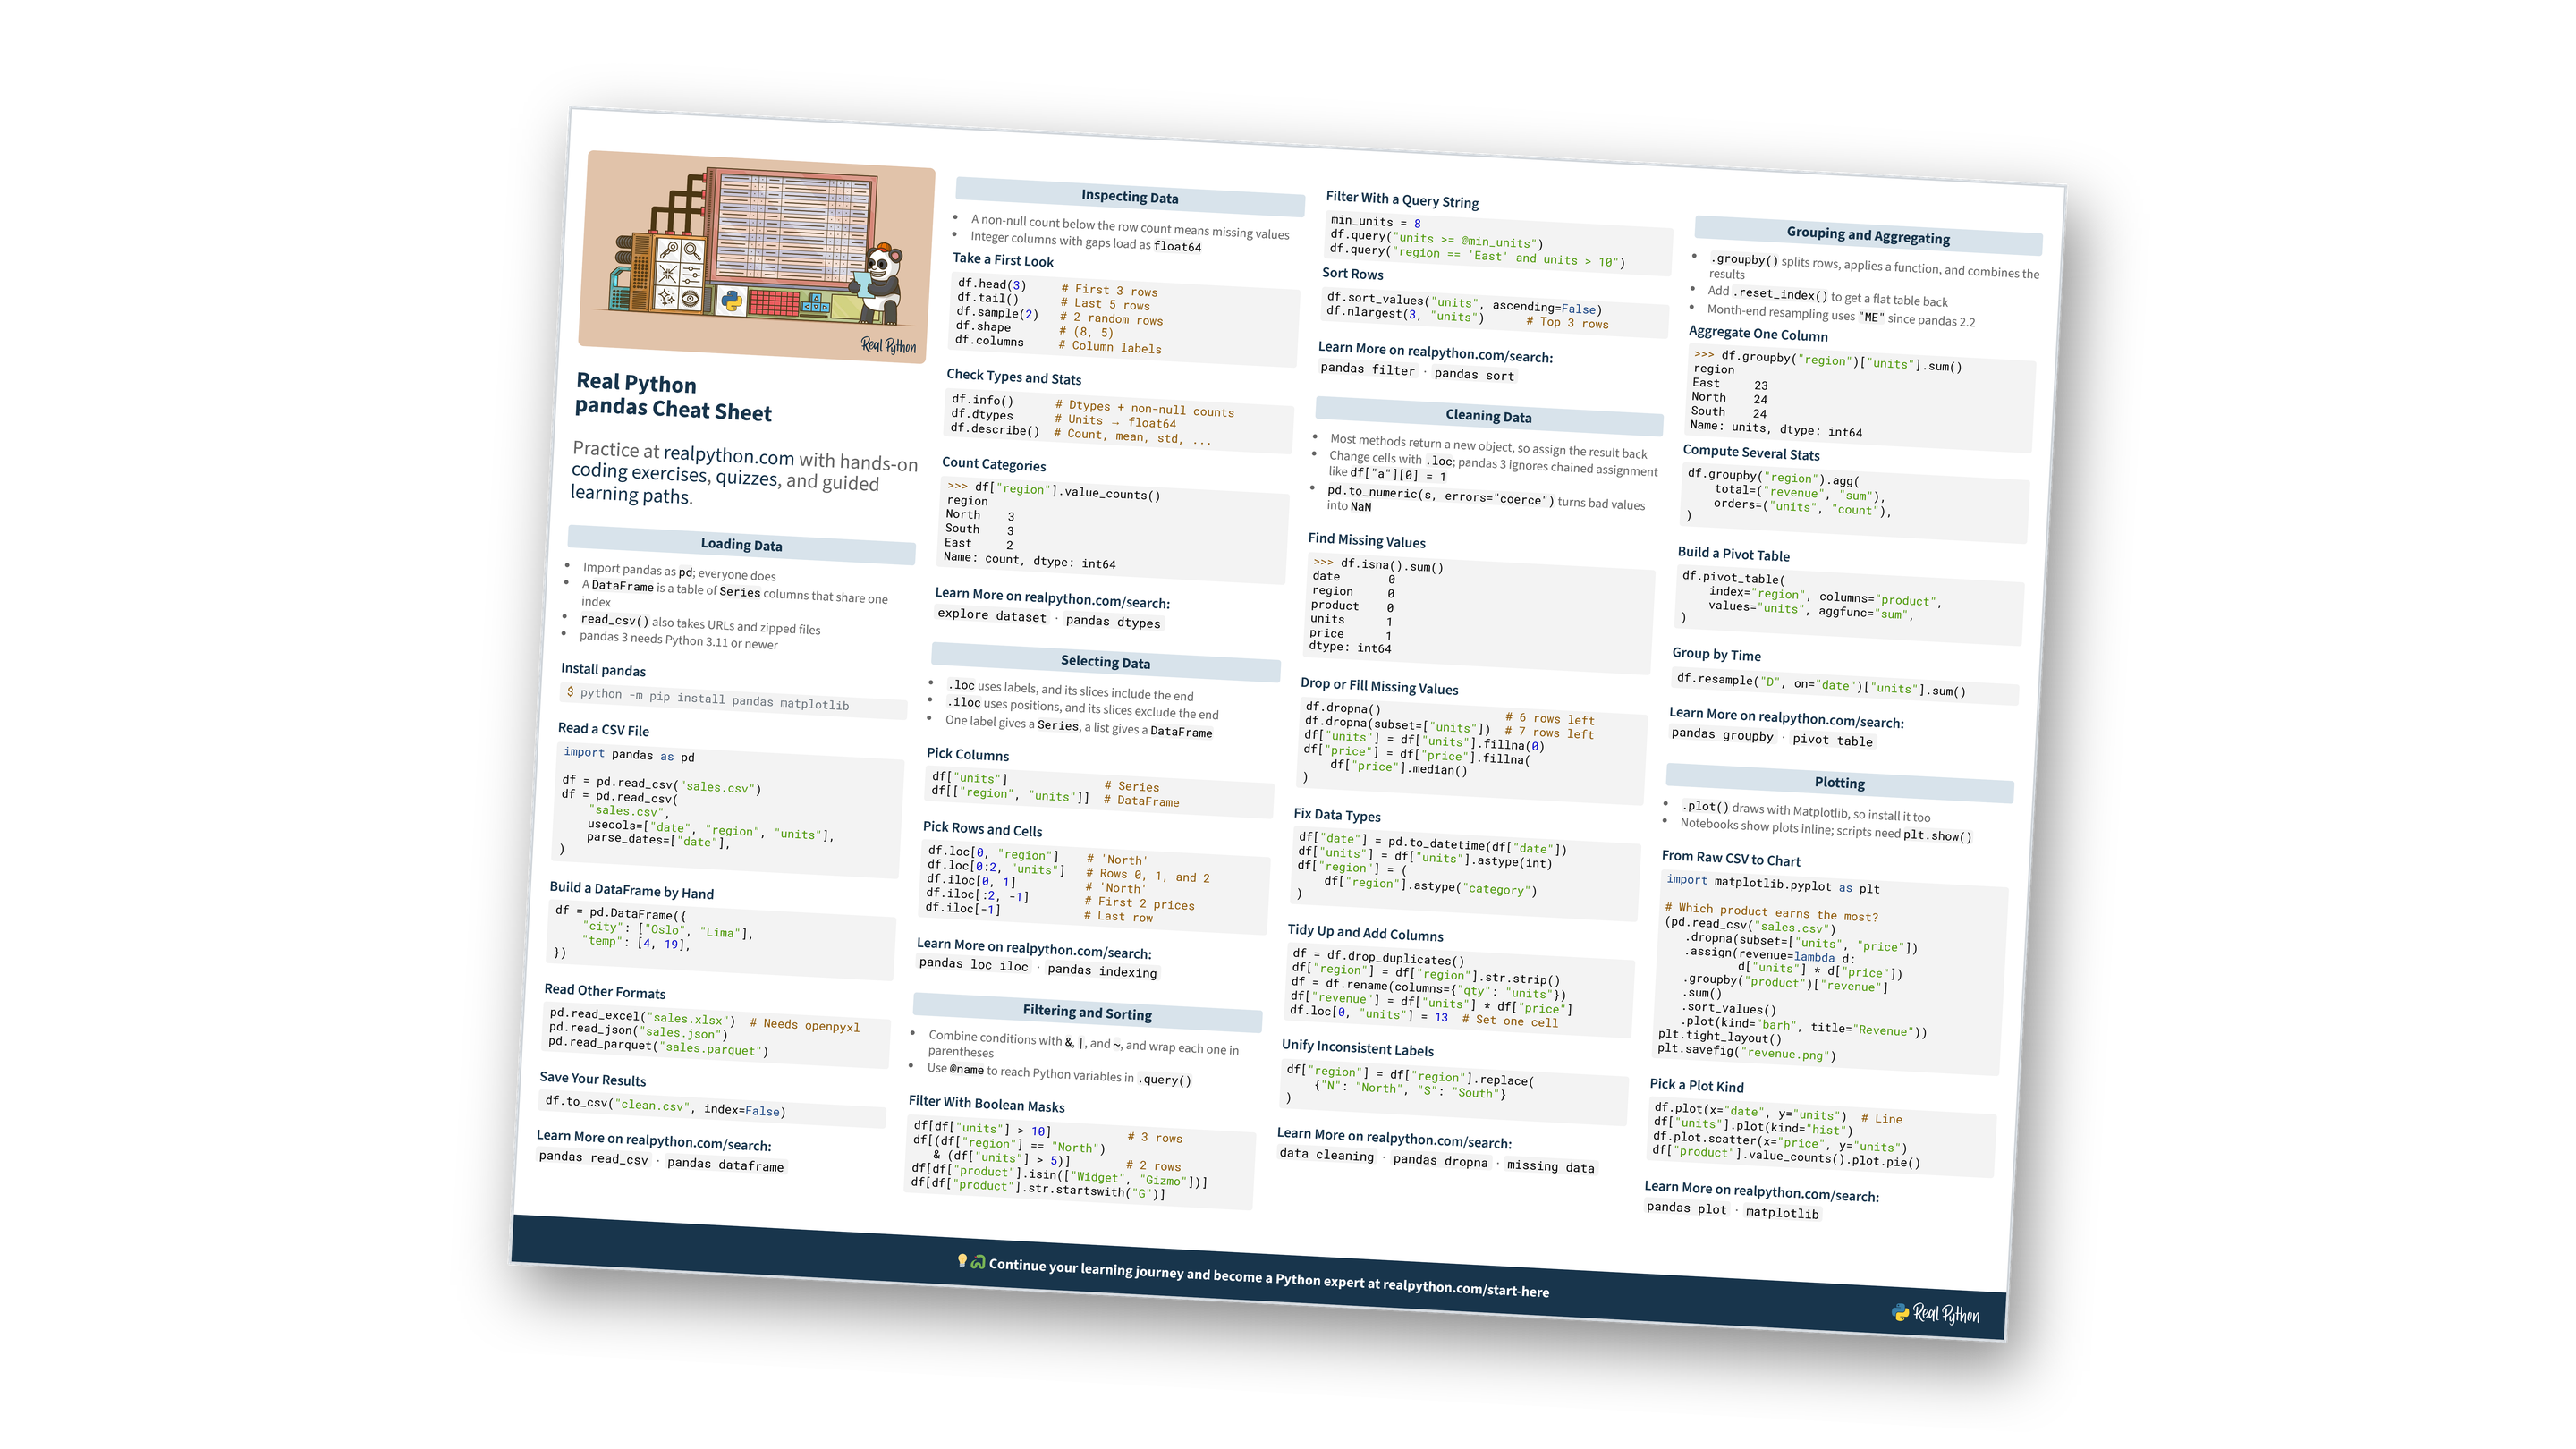
This Python pandas cheat sheet gives you a condensed overview of pandas, the go-to library for working with tabular data in Python. It covers loading and inspecting data, selecting and filtering rows and columns, cleaning messy values, grouping and aggregating, and plotting your results. The free download includes both the compact one-page cheat sheet and a detailed five-page edition. For the full explanations, see the tutorials behind it: Using pandas and Python to Explore Your Dataset, The pandas DataFrame, pandas GroupBy, and pandas: How to Read and Write Files. You can also download the information as a printable cheat sheet:
Free Bonus: pandas Cheat Sheets
Get two pandas cheat sheet PDFs, a compact one-pager and a detailed five-page edition, with the essentials for loading, inspecting, selecting, cleaning, grouping, and plotting your data:
Practice with hands-on coding exercises, quizzes, and guided learning paths. Not sure where to begin? Start here.
New to pandas?
Loading Data
- Import pandas as
pd; everyone does - A
DataFrameis a table ofSeriescolumns that share one index read_csv()also takes URLs and zipped files- pandas 3 needs Python 3.11 or newer
Install pandas
$ python -m pip install pandas matplotlib
Read a CSV File
import pandas as pd

df = pd.read_csv("sales.csv")
df = pd.read_csv(
    "sales.csv",
    usecols=["date", "region", "units"],
    parse_dates=["date"],
)
Build a DataFrame by Hand
df = pd.DataFrame({
    "city": ["Oslo", "Lima"],
    "temp": [4, 19],
})
Read Other Formats
pd.read_excel("sales.xlsx")  # Needs openpyxl
pd.read_json("sales.json")
pd.read_parquet("sales.parquet")
Save Your Results
df.to_csv("clean.csv", index=False)
Want to go deeper on loading data?
Inspecting Data
- A non-null count below the row count means missing values
- Integer columns with gaps load as
float64
Take a First Look
df.head(3)     # First 3 rows
df.tail()      # Last 5 rows
df.sample(2)   # 2 random rows
df.shape       # (8, 5)
df.columns     # Column labels
Check Types and Stats
df.info()      # Dtypes + non-null counts
df.dtypes      # Units → float64
df.describe()  # Count, mean, std, ...
Count Categories
>>> df["region"].value_counts()
region
North    3
South    3
East     2
Name: count, dtype: int64
Not sure what to look for first?
Selecting Data
.locuses labels, and its slices include the end.ilocuses positions, and its slices exclude the end- One label gives a
Series, a list gives aDataFrame
Pick Columns
df["units"]              # Series
df[["region", "units"]]  # DataFrame
Pick Rows and Cells
df.loc[0, "region"]    # 'North'
df.loc[0:2, "units"]   # Rows 0, 1, and 2
df.iloc[0, 1]          # 'North'
df.iloc[:2, -1]        # First 2 prices
df.iloc[-1]            # Last row
Counted the rows?
Filtering and Sorting
- Combine conditions with
&,|, and~, and wrap each one in parentheses - Use
@nameto reach Python variables in.query()
Filter With Boolean Masks
df[df["units"] > 10]           # 3 rows
df[(df["region"] == "North")
   & (df["units"] > 5)]        # 2 rows
df[df["product"].isin(["Widget", "Gizmo"])]
df[df["product"].str.startswith("G")]
Filter With a Query String
min_units = 8
df.query("units >= @min_units")
df.query("region == 'East' and units > 10")
Sort Rows
df.sort_values("units", ascending=False)
df.nlargest(3, "units")      # Top 3 rows
Think you can filter any DataFrame?
Free Bonus: Download both pandas cheat sheet PDFs, a compact one-pager and a detailed five-page edition, in one free bundle.
Cleaning Data
- Most methods return a new object, so assign the result back
- Change cells with
.loc; pandas 3 ignores chained assignment likedf["a"][0] = 1 pd.to_numeric(s, errors="coerce")turns bad values intoNaN
Find Missing Values
>>> df.isna().sum()
date       0
region     0
product    0
units      1
price      1
dtype: int64
Drop or Fill Missing Values
df.dropna()                  # 6 rows left
df.dropna(subset=["units"])  # 7 rows left
df["units"] = df["units"].fillna(0)
df["price"] = df["price"].fillna(
    df["price"].median()
)
Fix Data Types
df["date"] = pd.to_datetime(df["date"])
df["units"] = df["units"].astype(int)
df["region"] = (
    df["region"].astype("category")
)
Tidy Up and Add Columns
df = df.drop_duplicates()
df["region"] = df["region"].str.strip()
df = df.rename(columns={"qty": "units"})
df["revenue"] = df["units"] * df["price"]
df.loc[0, "units"] = 13  # Set one cell
Unify Inconsistent Labels
df["region"] = df["region"].replace(
    {"N": "North", "S": "South"}
)
Wondering why your change didn’t stick?
Grouping and Aggregating
.groupby()splits rows, applies a function, and combines the results- Add
.reset_index()to get a flat table back - Month-end resampling uses
"ME"since pandas 2.2
Aggregate One Column
>>> df.groupby("region")["units"].sum()
region
East     23
North    24
South    24
Name: units, dtype: int64
Compute Several Stats
df.groupby("region").agg(
    total=("revenue", "sum"),
    orders=("units", "count"),
)
Build a Pivot Table
df.pivot_table(
    index="region", columns="product",
    values="units", aggfunc="sum",
)
Group by Time
df.resample("D", on="date")["units"].sum()
Still fuzzy on groupby?
Plotting
.plot()draws with Matplotlib, so install it too- Notebooks show plots inline; scripts need
plt.show()
From Raw CSV to Chart
import matplotlib.pyplot as plt

# Which product earns the most?
(pd.read_csv("sales.csv")
   .dropna(subset=["units", "price"])
   .assign(revenue=lambda d:
           d["units"] * d["price"])
   .groupby("product")["revenue"]
   .sum()
   .sort_values()
   .plot(kind="barh", title="Revenue"))
plt.tight_layout()
plt.savefig("revenue.png")
Pick a Plot Kind
df.plot(x="date", y="units")  # Line
df["units"].plot(kind="hist")
df.plot.scatter(x="price", y="units")
df["product"].value_counts().plot.pie()
Want charts that tell a better story?
Ready to go beyond the cheat sheet?
You can download this information as a printable cheat sheet:
Free Bonus: pandas Cheat Sheets
Get two pandas cheat sheet PDFs, a compact one-pager and a detailed five-page edition, with the essentials for loading, inspecting, selecting, cleaning, grouping, and plotting your data:
