pandas for Data Science
Learning Path ⋅ Skills: pandas, Data Science, Data Visualization, DataFrame, GroupBy, Data Cleaning

pandas is the core library for data analysis in Python. This learning path takes you from your first DataFrame to writing fast, idiomatic pandas code.
By completing this path, you’ll be able to:
- Create, explore, and manipulate pandas DataFrames
- Read and write data files, then sort and clean messy datasets
- Build plots directly from pandas and analyze grouped data
- Combine datasets with merge operations and create pivot tables
- Speed up your pandas projects with performance best practices
This path is for Python developers who want to get productive with pandas for data analysis. Basic Python knowledge is the only prerequisite.
You’ll start with DataFrame fundamentals, move through cleaning and visualization, and finish with performance tuning and idiomatic patterns.
pandas for Data Science
Learning Path ⋅ 15 Resources
Getting Started With pandas
Get up and running with pandas. You’ll learn the basics of DataFrames and how to explore datasets.
Course
Introduction to pandas
Learn pandas DataFrames: explore, clean, and visualize data with powerful tools for analysis. Delete unneeded data, import data from a CSV file, and more.

Course
Explore Your Dataset With pandas
Learn how to start exploring a dataset with pandas and Python. You'll learn how to access specific rows and columns to answer questions about your data. You'll also see how to handle missing values and prepare to visualize your dataset in a Jupyter Notebook.

Course
The pandas DataFrame: Working With Data Efficiently
In this course, you'll get started with pandas DataFrames, which are powerful and widely used two-dimensional data structures. You'll learn how to perform basic operations with data, handle missing values, work with time-series data, and visualize data from a pandas DataFrame.
Interactive Quiz
The pandas DataFrame: Make Working With Data Delightful
Reading, Writing, and Cleaning Data
Learn how to read and write data files, sort and clean your data, and avoid common pitfalls with views and copies.
Course
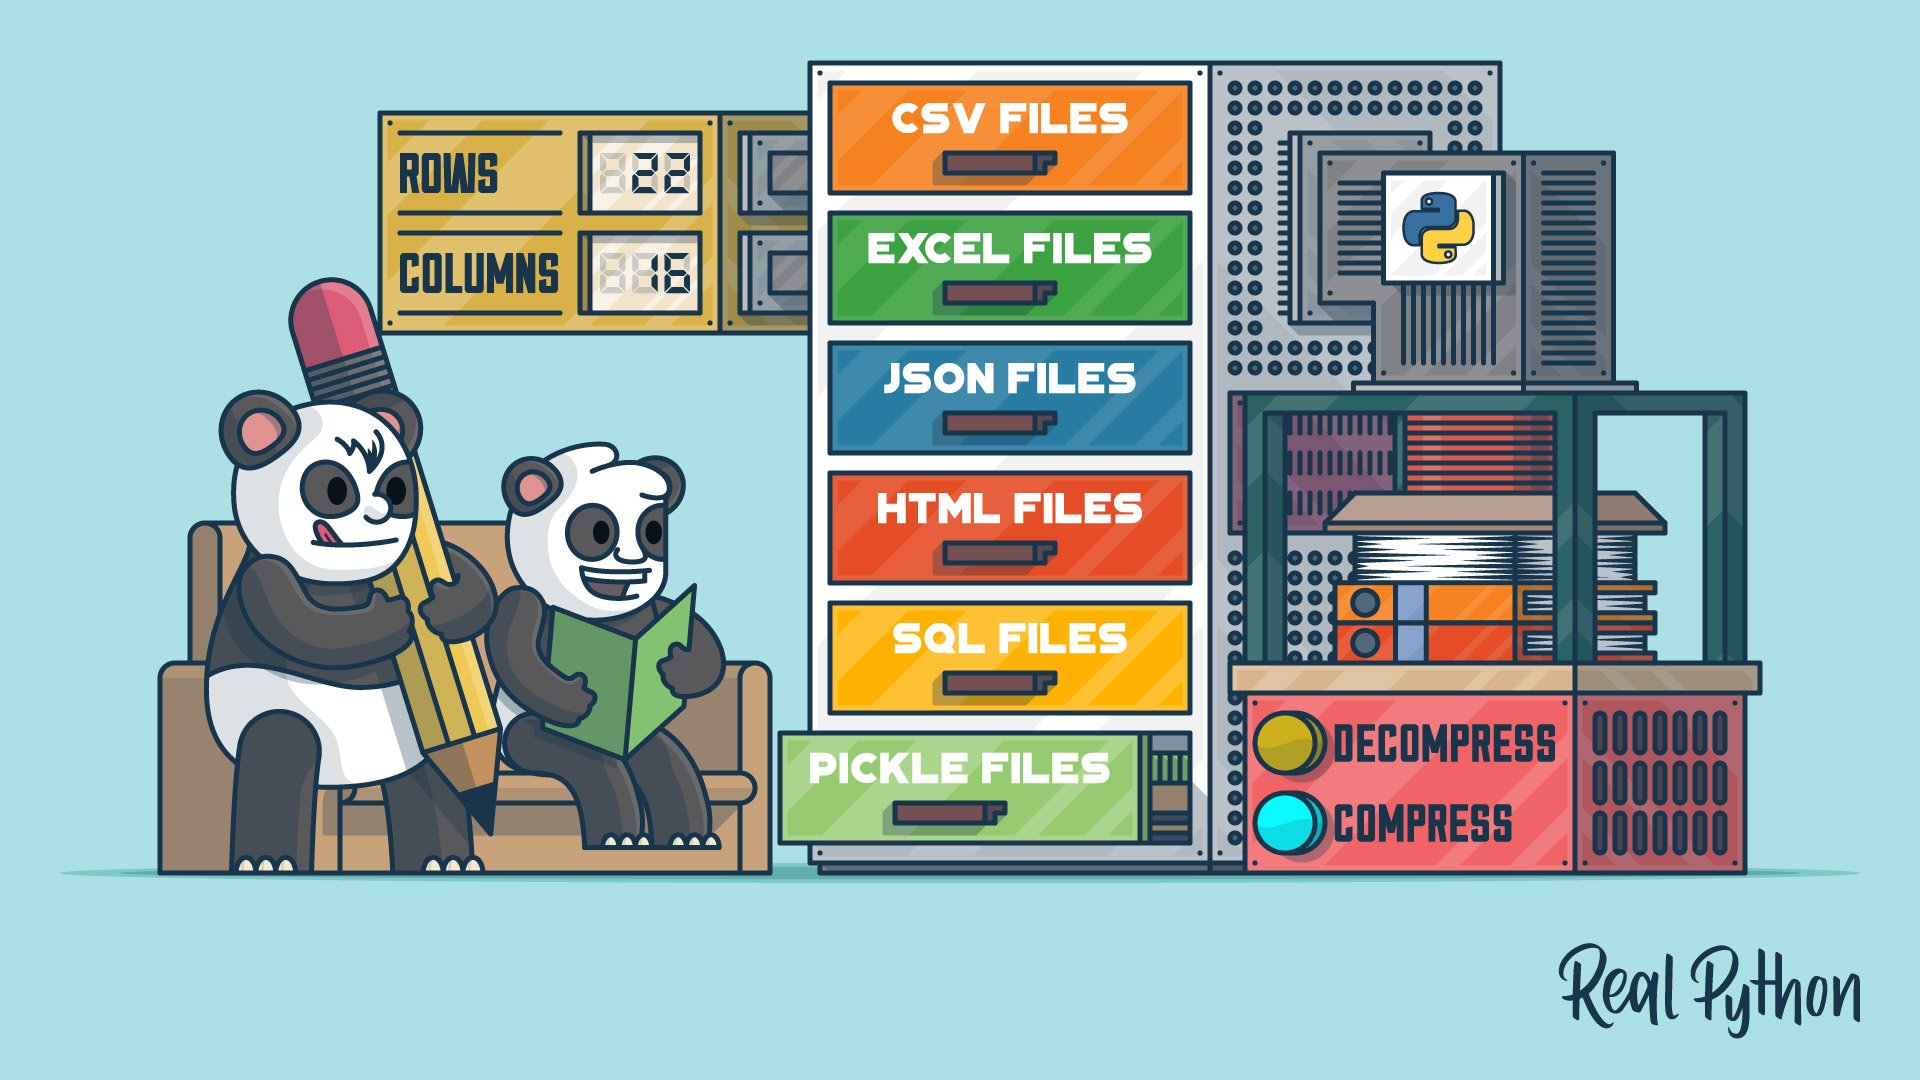
Reading and Writing Files With pandas
Learn about the pandas IO tools API and how you can use it to read and write files. You'll use the pandas read_csv() function to work with CSV files. You'll also cover similar methods for efficiently working with Excel, CSV, JSON, HTML, SQL, pickle, and big data files.
Course
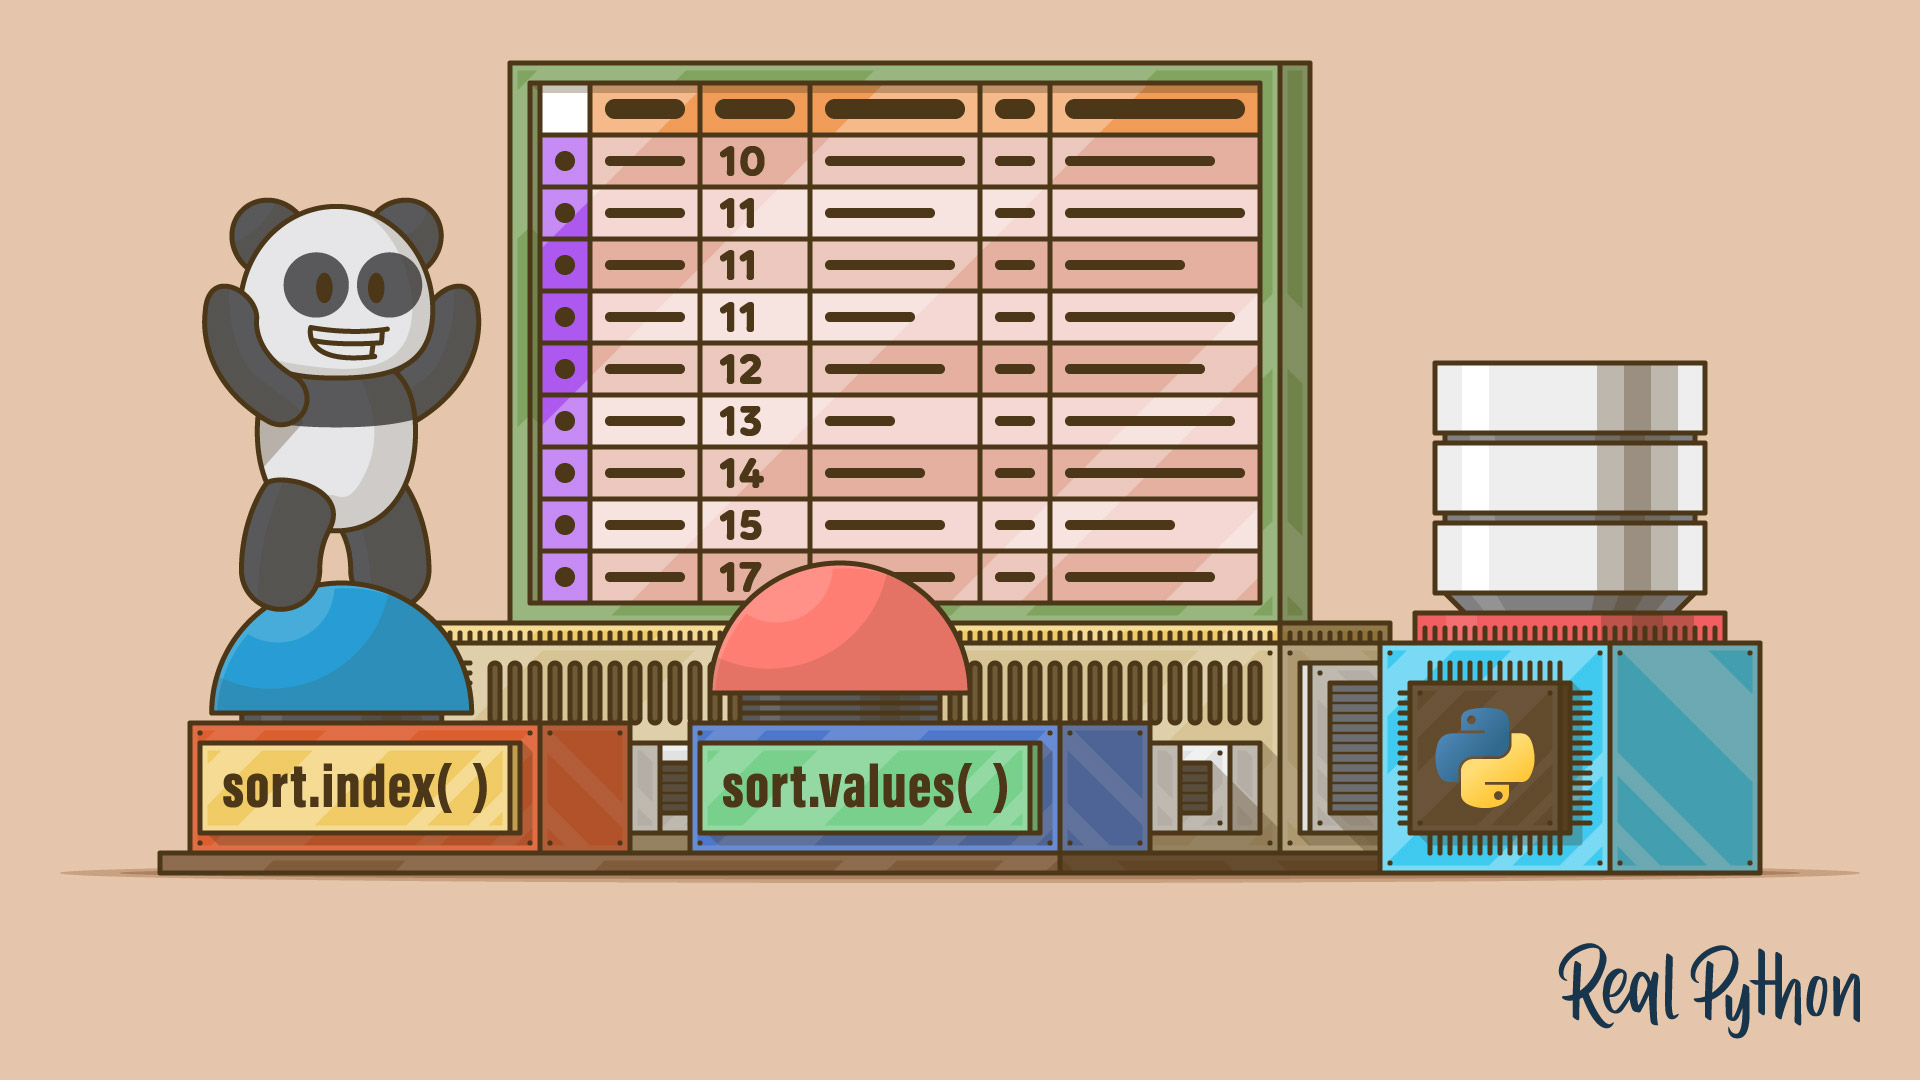
Sorting Data in Python With pandas
Learn how to sort data in a pandas DataFrame using the pandas sort functions sort_values() and sort_index(). You'll learn how to sort by one or more columns and by index in ascending or descending order.

Course
Data Cleaning With pandas and NumPy
Learn how to clean up messy data using pandas and NumPy. You'll become equipped to deal with a range of problems, such as missing values, inconsistent formatting, malformed records, and nonsensical outliers.
Tutorial
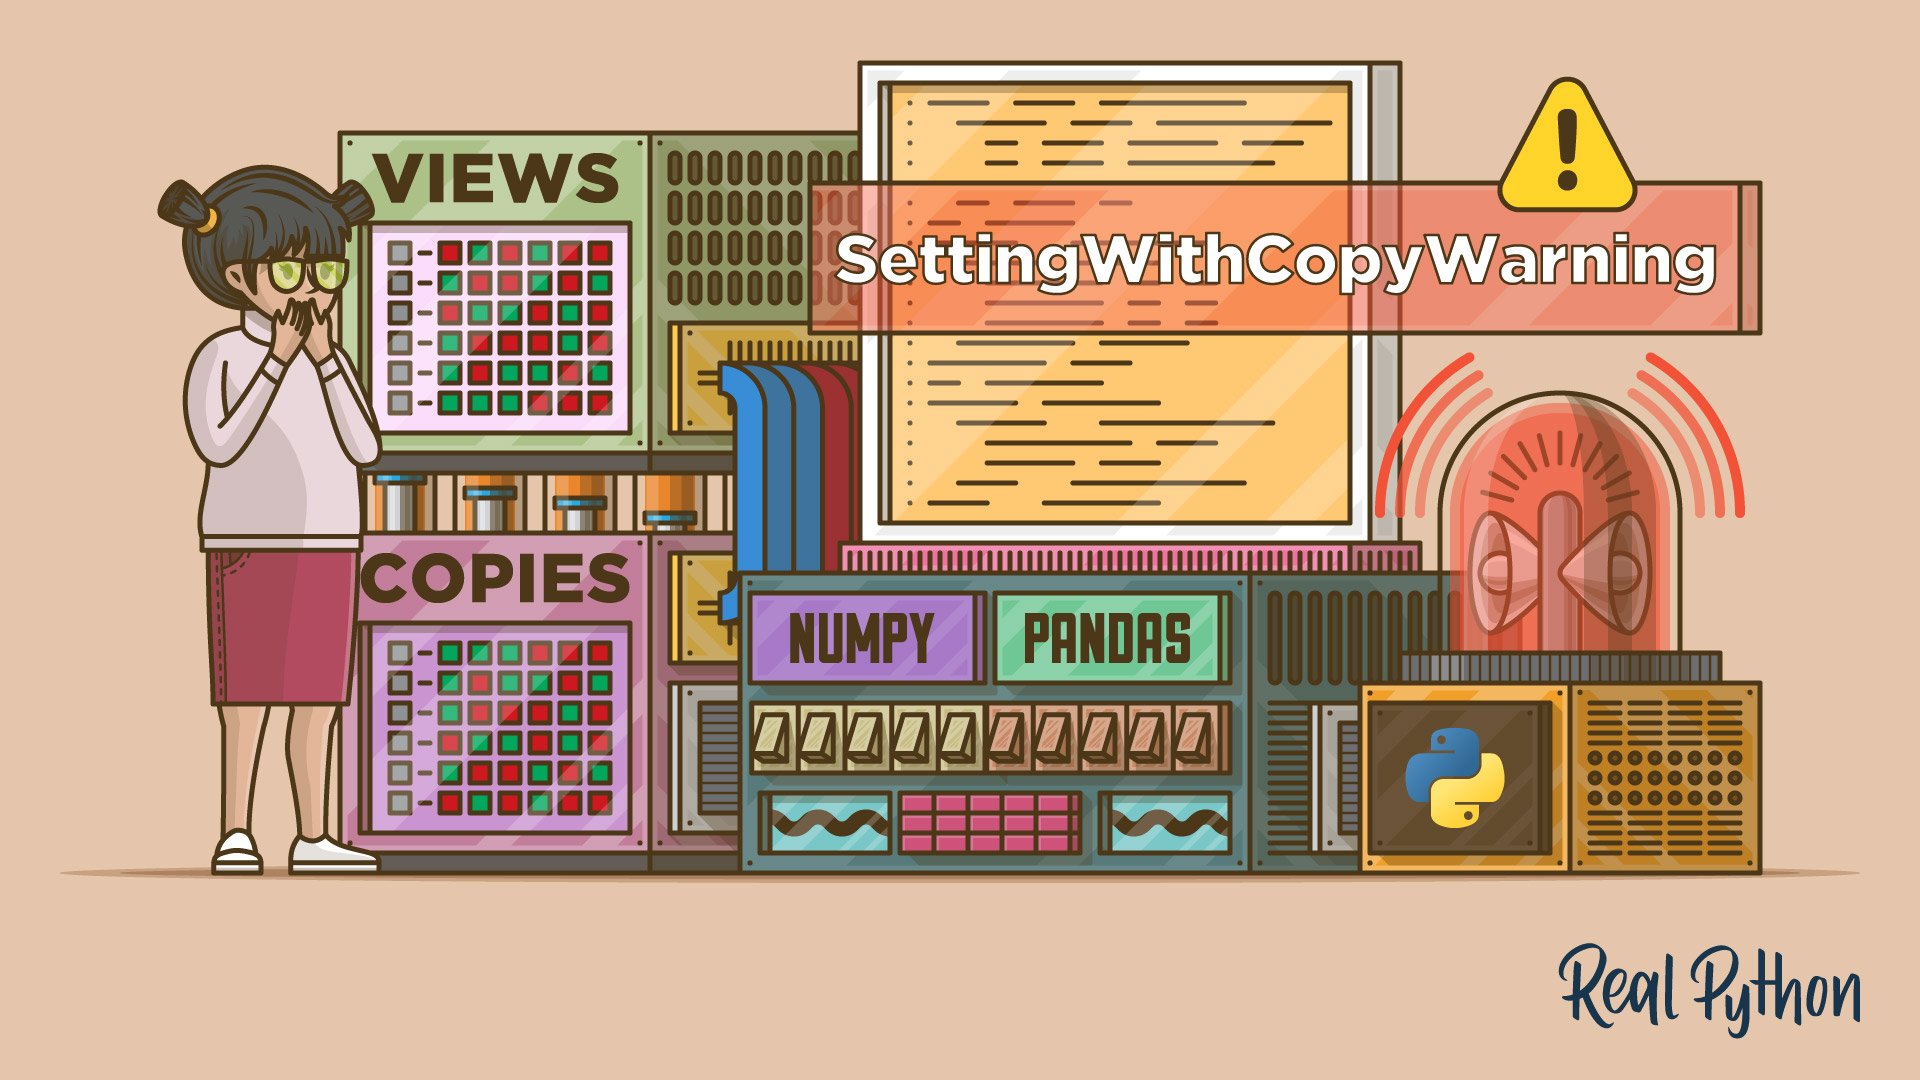
SettingWithCopyWarning in pandas: Views vs Copies
Learn about views and copies in NumPy and pandas. You'll see why the SettingWithCopyWarning occurs in pandas and how to properly write code that avoids it.
Visualizing and Analyzing Data
Create visualizations with pandas, group and combine data, build pivot tables, and compute correlations.

Course
Plot With pandas: Python Data Visualization Basics
In this course, you'll get to know the basic plotting possibilities that Python provides in the popular data analysis library pandas. You'll learn about the different kinds of plots that pandas offers, how to use them for data exploration, and which types of plots are best for certain use cases.

Course
pandas GroupBy: Grouping Real World Data in Python
Learn how to work adeptly with the pandas GroupBy while mastering ways to manipulate, transform, and summarize data. You'll work with real-world datasets and chain GroupBy methods together to get data into an output that suits your needs.


Course
Combining Data in pandas With concat() and merge()
Learn two techniques for combining data in pandas: merge() and concat(). Combining Series and DataFrame objects in pandas is a powerful way to gain new insights into your data.

Tutorial
How to Create Pivot Tables With pandas
Learn how to create pivot tables using pandas. You'll explore the key features of DataFrame's pivot_table() method and practice using them to aggregate your data in different ways.
Interactive Quiz
How to Create Pivot Tables With pandas
Tutorial
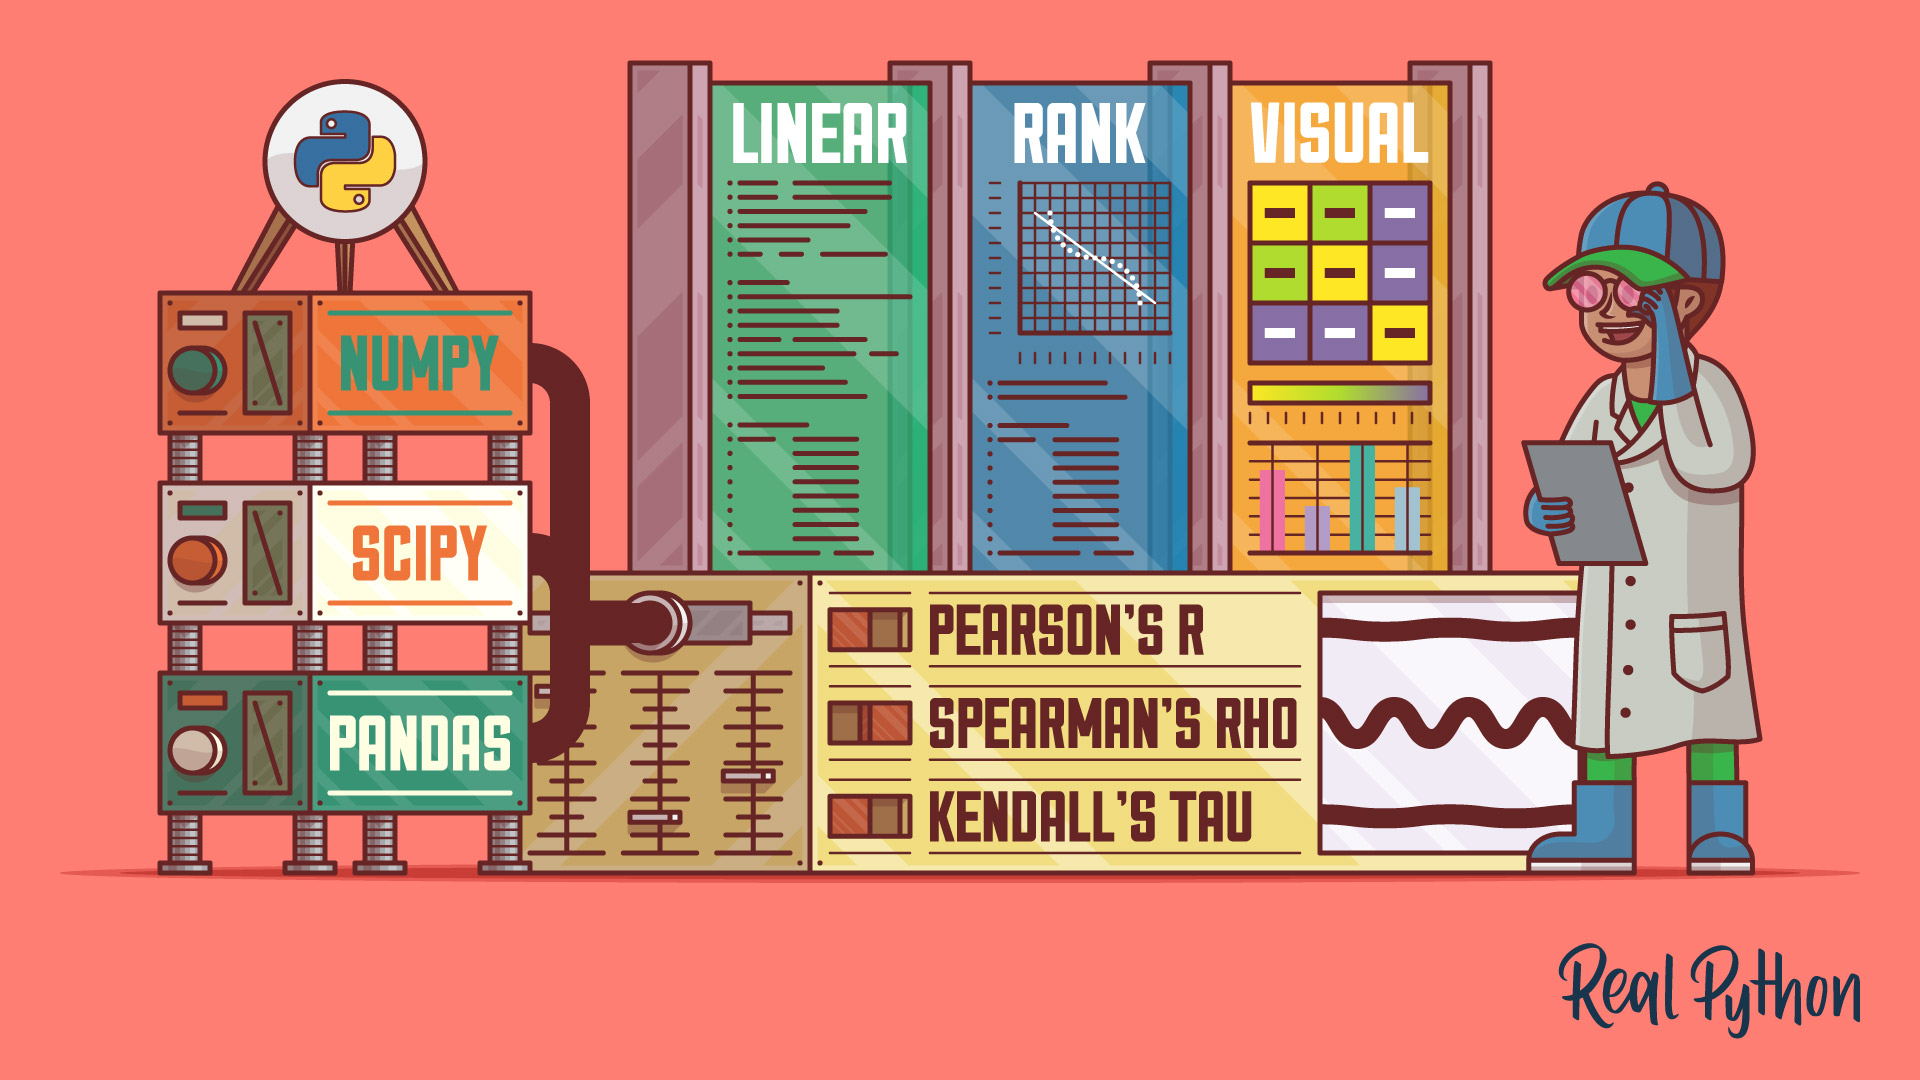
NumPy, SciPy, and pandas: Correlation With Python
Learn what correlation is and how you can calculate it with Python. You'll use SciPy, NumPy, and pandas correlation methods to calculate three different correlation coefficients. You'll also see how to visualize data, regression lines, and correlation matrices with Matplotlib.
Performance and Best Practices
Speed up your pandas code and learn idiomatic patterns. Put your skills to practice by building a gradebook project.

Tutorial
Fast, Flexible, Easy and Intuitive: How to Speed Up Your pandas Projects
What is it about pandas that has data scientists, analysts, and engineers raving? This is a guide to using pandas Pythonically to get the most out of its powerful and easy-to-use built-in features. Additionally, you will learn a couple of practical time-saving tips.

Course
Idiomatic pandas: Tricks & Features You May Not Know
In this course you'll see how to use some lesser-used but idiomatic pandas capabilities that lend your code better readability, versatility, and speed.
Course
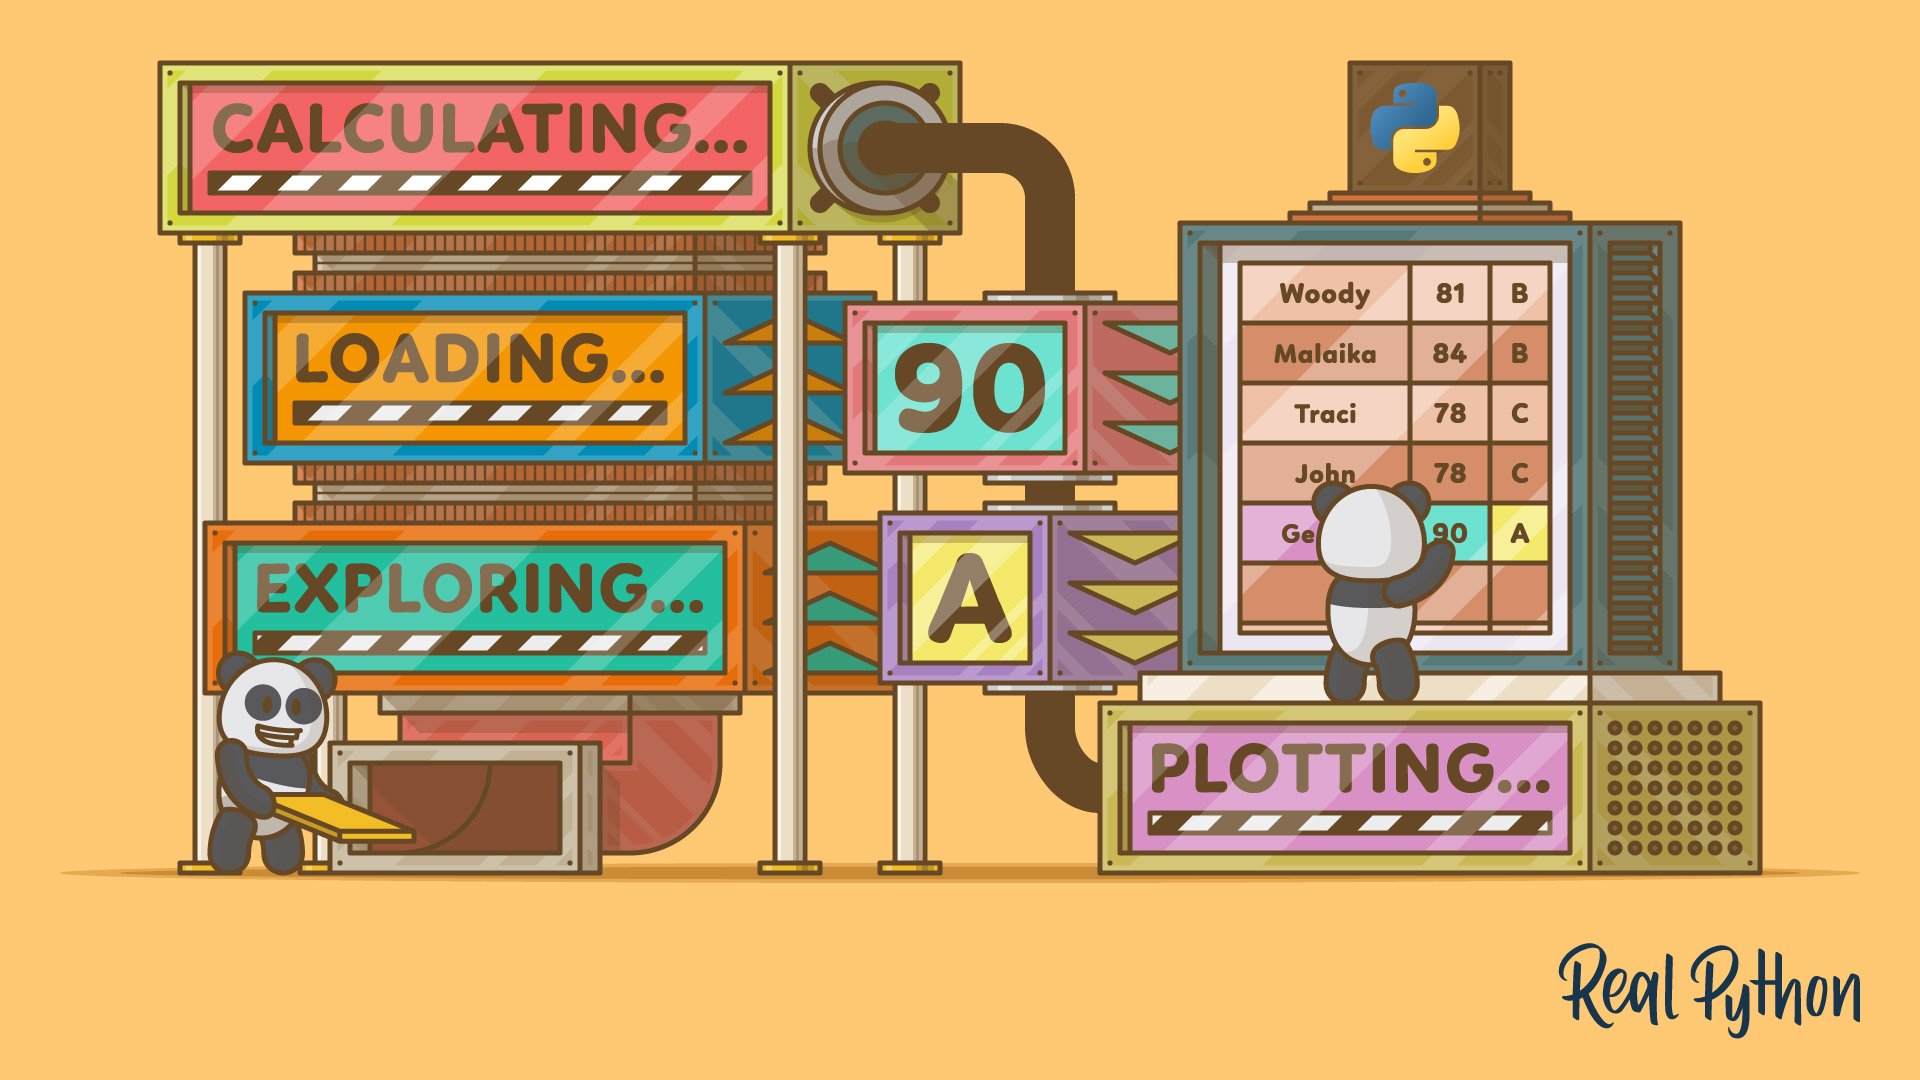
Using pandas to Make a Gradebook in Python
With this course and Python project, you'll build a script to calculate grades for a class using pandas. The script will quickly and accurately calculate grades from a variety of data sources. You'll see examples of loading, merging, and saving data with pandas, as well as plotting some summary statistics.
Congratulations on completing this learning path! You’ve learned how to use pandas for data analysis in Python, from DataFrames and data cleaning to visualization and advanced operations.
If you’d like to continue building your data skills, check out these related learning paths:
Got feedback on this learning path?
Looking for real-time conversation? Visit the Real Python Community Chat or join the next “Office Hours” Live Q&A Session. Happy Pythoning!
