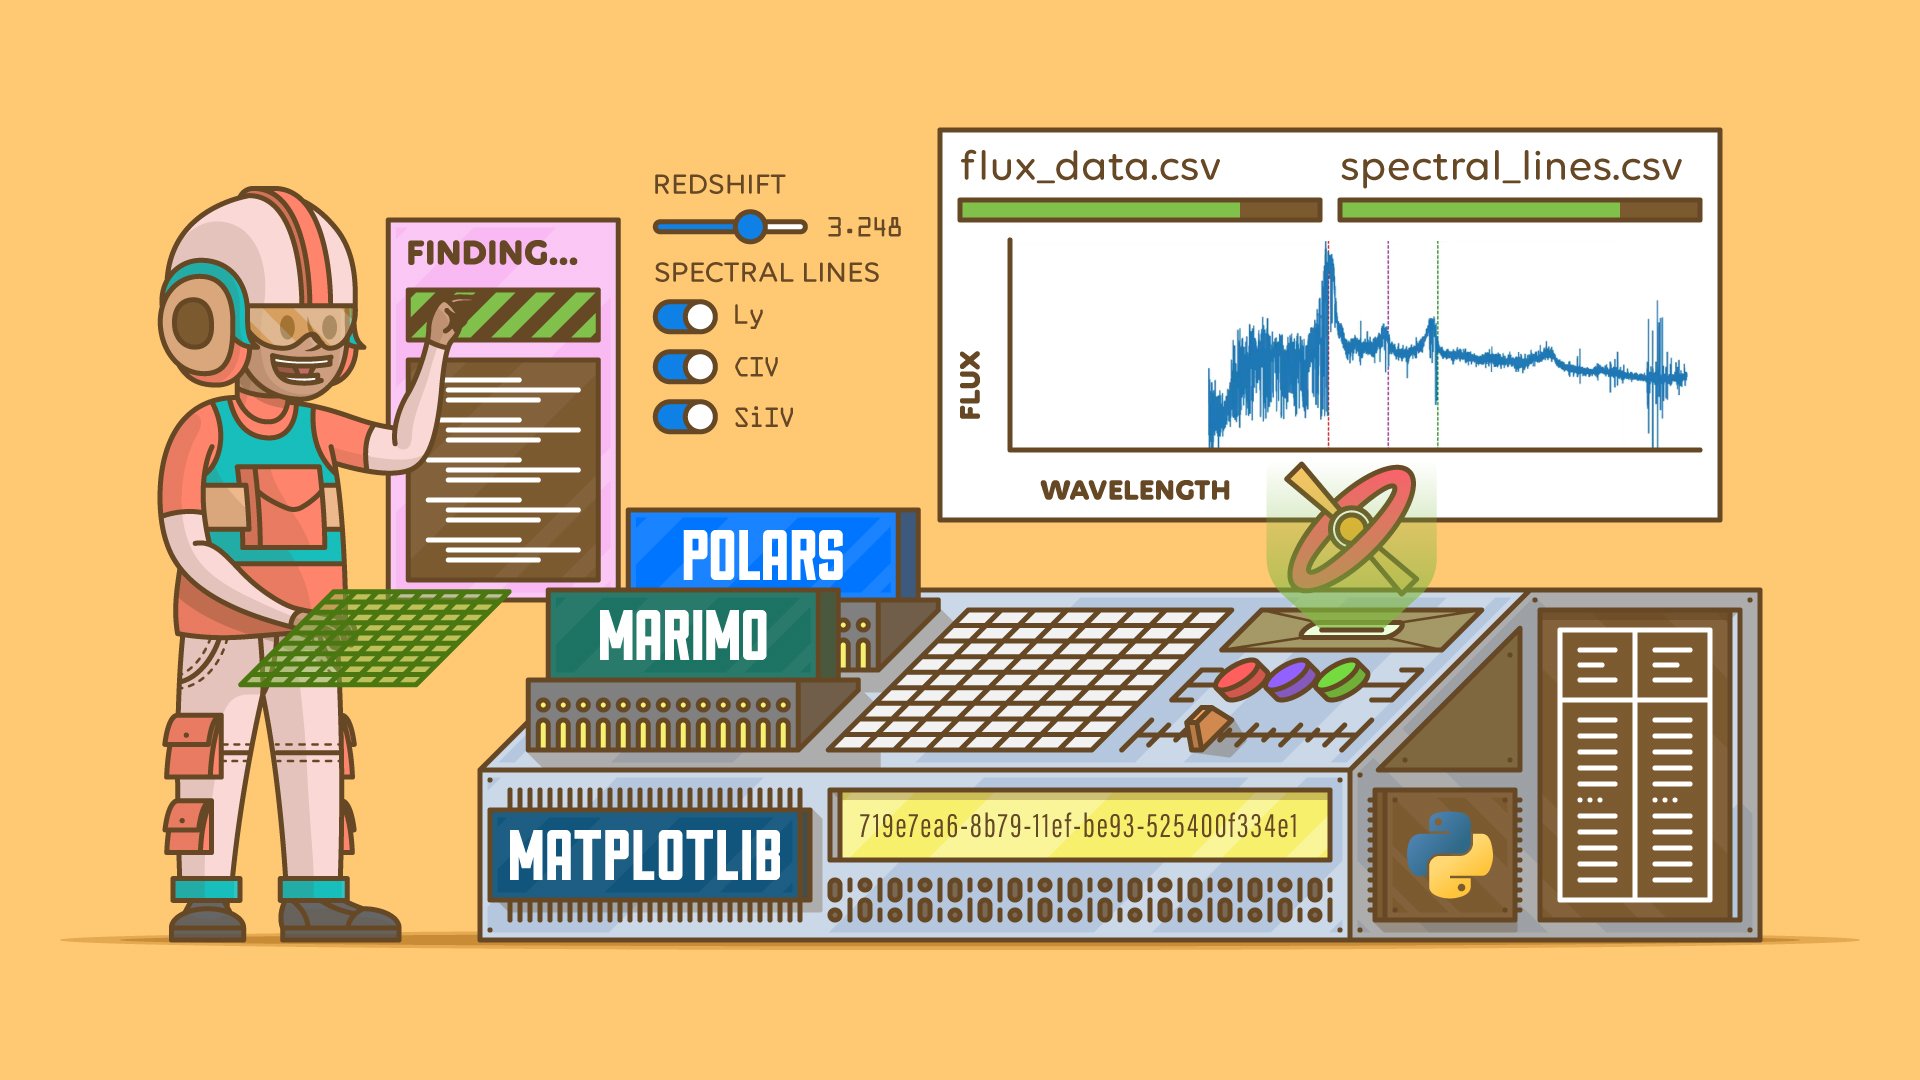
Investigating Quasar Data With Polars and Interactive marimo Notebooks
Learn to visualize quasar redshift data by building an interactive marimo dashboard using Polars, pandas, and Matplotlib. You'll practice retrieving, cleaning, and displaying data in your notebook. You'll also build interactive UI components that live-update visualizations in the notebook.
Oct 21, 2025 intermediate data-science data-viz web-dev
Explore Real Python


Python Descriptors
Oct 14, 2025 intermediate python


What's New in Python 3.14
Oct 07, 2025 intermediate python


Modern Python Linting With Ruff
Sep 30, 2025 intermediate devops tools

Python MCP Server: Connect LLMs to Your Data
Sep 24, 2025 intermediate ai

Get Started With FastAPI
Sep 22, 2025 intermediate api front-end web-dev
Python Project Management With uv
Sep 16, 2025 intermediate tools