Adding observability to your applications is crucial for diagnosing issues in production. In this tutorial, you’ll learn how to integrate OpenTelemetry—an open-source observability framework—into a FastAPI application. After following along, you’ll be able to instrument FastAPI with OpenTelemetry to export traces and correlate them with your application logs, allowing you to explore your telemetry in a dedicated dashboard:
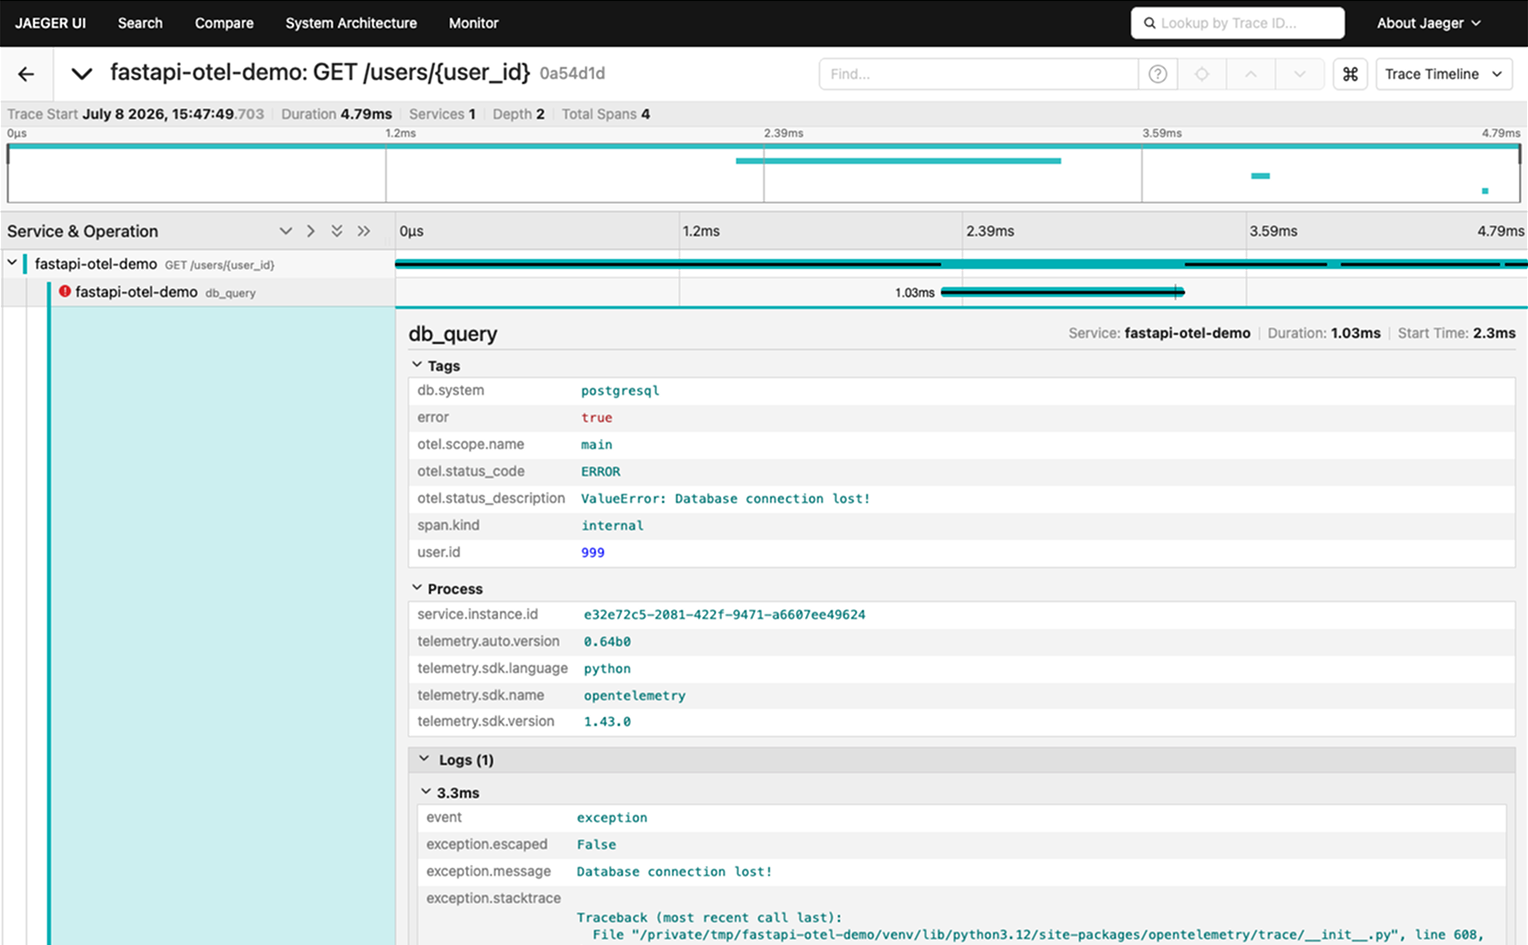
The image above previews the Jaeger UI that you’ll build toward over the course of this tutorial.
As your application grows, tracking down bugs across different services can become challenging. By adding observability, you gain clear insights into how your application performs and exactly where errors happen.
To achieve this, you’ll use OpenTelemetry, often called OTel. This vendor-neutral framework provides a standard way to collect telemetry data from your applications. It supports multiple programming languages, including Python, and exports data to various backends like Jaeger, Prometheus, and Grafana.
For this tutorial, you’ll use Jaeger, a popular open-source backend, to visualize your data. Together, OpenTelemetry and Jaeger let you analyze request paths, troubleshoot errors, and understand system bottlenecks.
Prerequisites
To follow along with this tutorial, you’ll need a couple of tools on your system:
- Python 3.10 or higher
- Docker to run the Jaeger backend container
Even if you’re new to Docker, you’ll only run a single command to start a ready-made container, and this tutorial walks you through it. If you’d like to go deeper, then you can explore the Docker tutorials later.
You should also be comfortable with a basic FastAPI app. If you need a refresher on the framework, then check out the introductory guide to get started with FastAPI. If you prefer learning by video, Real Python’s Start Building With FastAPI course covers the same essentials.
You can download the complete source code for the examples in this tutorial to use as a reference:
Get Your Code: Click here to download the free sample code you’ll use to instrument a FastAPI app with OpenTelemetry, exporting traces to a Jaeger backend, adding custom spans, correlating logs with traces, and tuning sampling.
Take the Quiz: Test your knowledge with our interactive “How to Integrate OpenTelemetry With a FastAPI App” quiz. You’ll receive a score upon completion to help you track your learning progress:
Interactive Quiz
How to Integrate OpenTelemetry With a FastAPI AppInstrument a FastAPI app with OpenTelemetry to export traces, add custom spans, and correlate your application logs with traces.
Step 1: Build Your FastAPI OpenTelemetry Pipeline
To begin, you need a backend to receive and display your traces. Jaeger’s all-in-one Docker image bundles everything into a single container for local development.
Open your terminal and start the Jaeger container using Docker:
$ docker run -d --name jaeger \
    -p 16686:16686 \
    -p 4317:4317 \
    -p 4318:4318 \
    jaegertracing/all-in-one:latest
This command launches Jaeger in the background. The port mappings each serve a distinct purpose. Port 16686 exposes the web UI that you’ll use to explore your traces, while ports 4317 and 4318 accept incoming telemetry via the OpenTelemetry Protocol (OTLP) over gRPC and HTTP, respectively. Keeping these apart matters later because your application will send data to an OTLP port, and you’ll view the results on the UI port.
Next, you’ll install the FastAPI framework along with the OpenTelemetry libraries. Before you do, create and activate a virtual environment so that the packages don’t end up in your system Python:
With your virtual environment active, install the packages. You’ll need the core OpenTelemetry distribution, the specific FastAPI instrumentation package, and the OTLP exporter to send your data to Jaeger:
(venv) $ python -m pip install fastapi uvicorn \
         opentelemetry-distro \
         opentelemetry-instrumentation-fastapi \
         opentelemetry-exporter-otlp
Now that the tools are installed, you can build your application. Create a file named main.py and add the following code:
main.py
from fastapi import FastAPI

app = FastAPI()

@app.get("/")
def read_root():
    return {"message": "Hello, OpenTelemetry!"}
Notice that this is a plain FastAPI application. There’s no tracing code in it at all, and that’s the point: you’ll instrument it from the outside without touching your source code.
To make that work, three OpenTelemetry components need to come together:
- Instrumentation: The
opentelemetry-instrumentation-fastapipackage you installed hooks into FastAPI’s request handling and generates telemetry data for each incoming HTTP request. - SDK: The OpenTelemetry SDK receives that data, records it, and batches it for delivery.
- Exporter: The OTLP exporter formats the recorded data and sends it to a backend like Jaeger.
Here’s how these components connect and where your data flows:
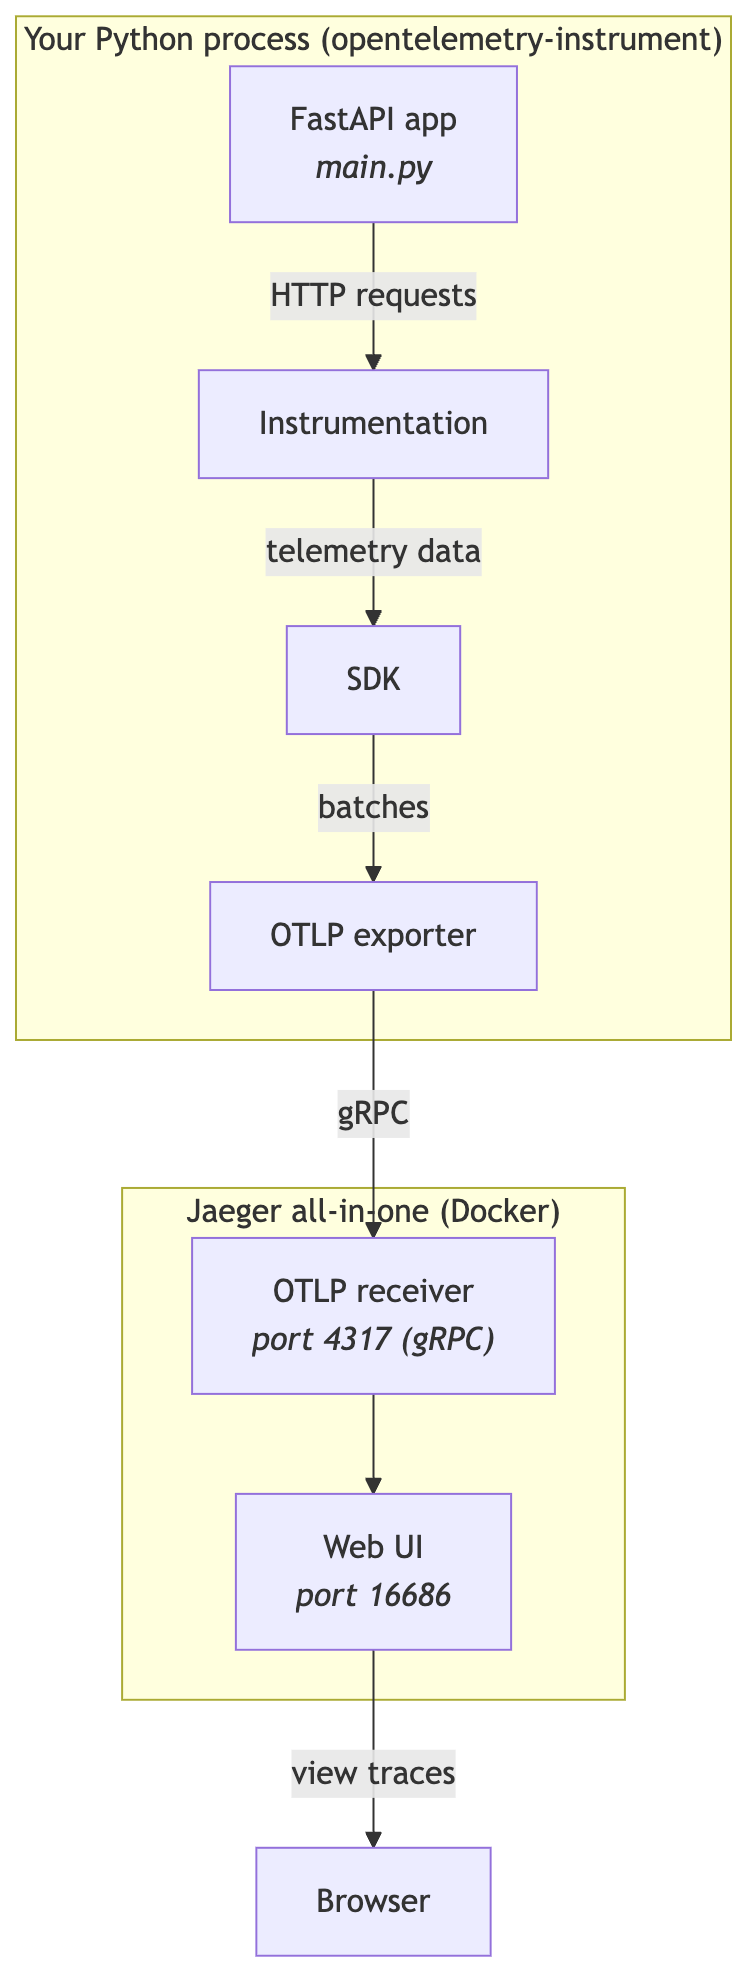
Everything in the top box runs inside your Python process, wired up by the opentelemetry-instrument tool. Only the OTLP data crosses the process boundary. It travels down to the Jaeger container, where you can explore it in the web UI.
Wiring these components up by hand requires a fair amount of boilerplate setup code. Instead, you can use the opentelemetry-instrument CLI tool, which reads your environment variables and configures the whole pipeline automatically. This keeps your application code focused on business logic.
Note: You can also configure everything in code instead. In that approach, you’d set up the SDK’s tracer provider and exporter in main.py and then call FastAPIInstrumentor.instrument_app(app) to instrument your application explicitly. This gives you finer-grained control over the tracing pipeline, at the cost of extra setup code that the CLI tool otherwise handles for you. You can learn more in the FastAPI instrumentation documentation.
Wrap your standard Uvicorn startup command with the CLI tool and pass the necessary environment variables to configure your exporter:
$ OTEL_SERVICE_NAME="fastapi-otel-demo" \
  OTEL_METRICS_EXPORTER="none" \
  OTEL_TRACES_EXPORTER="otlp" \
  OTEL_EXPORTER_OTLP_ENDPOINT="http://localhost:4317" \
  OTEL_EXPORTER_OTLP_INSECURE="true" \
  opentelemetry-instrument python -m uvicorn main:app --reload
Here’s what each environment variable does:
OTEL_SERVICE_NAME: Labels your telemetry so that you can tell this application apart from other services in the Jaeger UI.OTEL_METRICS_EXPORTER: Disables metrics, which are numerical measurements like request counts or memory usage. OpenTelemetry collects them alongside traces by default, but Jaeger only accepts traces, so the metrics pipeline would repeatedly fail and fill your terminal with export errors.OTEL_TRACES_EXPORTER: Selects the OTLP exporter for traces.OTEL_EXPORTER_OTLP_ENDPOINT: Points the exporter at port4317, which is the gRPC port that you exposed when starting the Jaeger container. The Python exporter uses gRPC by default, so you target4317rather than the HTTP port4318.OTEL_EXPORTER_OTLP_INSECURE: Allows an unencrypted local connection, which is fine for development but not something you’d use in production.
Together, these variables tell opentelemetry-instrument what to collect, how to export it, and where to send it. The --reload flag automatically restarts the server whenever you change a source file, so you won’t need to stop and start it manually after every edit.
With the server running, open your browser and go to http://localhost:8000/. You’ll see the successful JSON response: {"message": "Hello, OpenTelemetry!"}.
Now, open the Jaeger UI at http://localhost:16686. Under the Service dropdown, select fastapi-otel-demo and click Find Traces. You’ll see that OpenTelemetry has automatically captured your HTTP request without you writing any tracing code.
Note: OpenTelemetry batches data to save resources, so you may need to wait about five seconds and click again if it doesn’t appear immediately.
Additionally, the Jaeger all-in-one Docker image uses transient in-memory storage by default. This means that if you stop or restart the container, then all your collected trace data will be lost. This behavior is perfect for local development, but production setups require a persistent storage backend like Elasticsearch or Cassandra.
While auto-instrumentation gives you a great overview of your HTTP requests, it reveals little about your specific application logic. You’ll fix that next.
Step 2: Add Custom Spans for Business Logic
In OpenTelemetry, a trace tracks the complete journey of a request as it flows through your system, while a span represents a single unit of work within that trace. Auto-instrumentation creates spans for your overall HTTP request lifecycles.
However, auto-instrumentation treats your application endpoints like black boxes. If an endpoint takes three seconds to return a response, then auto-instrumentation will show you the total time, but it won’t tell you why it took so long. Was it a slow database query, a lagging external API, or heavy CPU processing?
To get these answers, you need to manually create custom spans. Custom spans allow you to wrap specific pieces of your internal business logic and measure their exact performance.
More importantly, they let you attach custom attributes to the telemetry data. By tagging spans with business-specific context, such as a user ID or a database name, you can quickly filter and search through thousands of traces. This helps you find exactly what you need when debugging a production issue.
Update your main.py to add a simulated database query and a FastAPI endpoint:
main.py
from fastapi import FastAPI
from opentelemetry import trace

app = FastAPI()
tracer = trace.get_tracer(__name__)

def simulate_db_query(user_id: int):
    with tracer.start_as_current_span("db_query") as span:
        span.set_attribute("db.system", "postgresql")
        span.set_attribute("user.id", user_id)

        if user_id == 999:
            raise ValueError("Database connection lost!")

        return {"name": "Demo User", "role": "admin"}

@app.get("/users/{user_id}")
def get_user(user_id: int):
    try:
        data = simulate_db_query(user_id)
        return {"status": "success", "data": data}
    except ValueError:
        return {"status": "error", "message": "Failed to fetch user"}

@app.get("/")
# ...
Here, you call trace.get_tracer(__name__) to get a tracer instance, which serves as your entry point for creating spans. Passing __name__ tags every span that this tracer creates with the name of the current module. When you later browse traces that stretch across dozens of files, this tells you exactly which part of your codebase produced each span.
You then use start_as_current_span() to track the simulate_db_query() function. You also use set_attribute() to attach custom attributes to the span, such as the database system and the specific user ID. Capturing these details lets you narrow down traces in the backend later.
Notice the attribute name db.system. This isn’t an arbitrary label. It comes from OpenTelemetry’s semantic conventions, which define standard attribute names for common operations like database queries and HTTP calls.
For purely business-specific data like user.id, inventing your own attribute names is perfectly fine. For well-known concepts, though, you should stick to the conventions. Observability backends recognize these standard names and can build filters and visualizations on top of them automatically. In short, following the conventions keeps your telemetry portable across tools.
Save your changes (the --reload flag picks them up automatically) and visit http://localhost:8000/users/1. Back in the Jaeger UI, open the newest trace and expand it—you’ll find the db_query span nested inside the request span, along with the db.system and user.id attributes that you just set.
Crucially, you simulate an error condition for user 999. When the exception propagates out of the with block, start_as_current_span() automatically records it on the span with its full stack trace and sets the span status to error. This detailed context is invaluable when you’re tracking down a failure in a live system.
The waterfall below shows both requests the way Jaeger renders them. Switch between the healthy call and the failing one for user 999 to watch the db_query span nest inside the request span and turn red when the exception is recorded:
What if you handle an exception instead of letting it escape? Expand the collapsible section below to learn how to record it manually:
Automatic exception recording only works when the exception propagates out of the with block, where the context manager can see it. If you catch and handle it inside the span instead, then OpenTelemetry never sees it, and it’s up to you to record the exception yourself:
def simulate_db_query(user_id: int):
    with tracer.start_as_current_span("db_query") as span:
        try:
            row = fetch_user_row(user_id)
        except ConnectionError as exc:
            span.record_exception(exc)
            span.set_status(trace.Status(trace.StatusCode.ERROR))
            return {"name": "Unknown User", "role": "guest"}
        return row
In this variation, the endpoint returns fallback data instead of failing the request. You call .record_exception() with the caught exception and mark the span as failed with .set_status(). Make sure that you pass the exception you actually caught, because a freshly created exception carries no real stack trace.
You won’t need this manual approach in the rest of this tutorial, but it’s a common pattern whenever you handle errors gracefully while keeping visibility into them.
Step 3: Correlate Logs With Traces
To get a complete observability picture, you need to correlate your standard Python logs with your OpenTelemetry traces. You can achieve this by extracting both the trace ID and the span ID from the current span context.
Update your main.py to configure structured logging and inject the trace ID and span ID:
main.py
import logging

from fastapi import FastAPI
from opentelemetry import trace

app = FastAPI()
tracer = trace.get_tracer(__name__)

logging.basicConfig(level=logging.INFO)
logger = logging.getLogger(__name__)

def simulate_db_query(user_id: int):
    with tracer.start_as_current_span("db_query") as span:
        span.set_attribute("db.system", "postgresql")
        span.set_attribute("user.id", user_id)

        trace_id = format(span.get_span_context().trace_id, "032x")
        span_id = format(span.get_span_context().span_id, "016x")

        if user_id == 999:
            logger.error(
                "DB query failed for user %s. trace_id=%s, span_id=%s",
                user_id,
                trace_id,
                span_id,
            )
            raise ValueError("Database connection lost!")

        logger.info(
            "Executing DB query for user %s. trace_id=%s, span_id=%s",
            user_id,
            trace_id,
            span_id,
        )
        return {"name": "Demo User", "role": "admin"}

@app.get("/users/{user_id}")
def get_user(user_id: int):
    logger.info("Received request for user %s", user_id)
    # ...
You extract the current trace_id and span_id from the span context. Notice that you use the built-in format() function with the format specifiers "032x" and "016x". These convert the internal integer IDs into a 32-character and a 16-character lowercase hexadecimal string, respectively.
Why this specific format? OpenTelemetry adheres to the W3C Trace Context specification. This is an open standard that defines how trace context should be formatted and propagated between services. By formatting trace IDs as 32-character hex strings and span IDs as 16-character hex strings, you ensure that your logs speak a universal language.
Whether you’re exporting data to Jaeger or any other observability backend, formatting your IDs to this W3C standard guarantees that the backend can instantly recognize and stitch your logs and traces together.
You then explicitly inject both identifiers into your log messages. Now, every log message generated during a request can be cross-referenced and attached to its exact span in your Jaeger UI.
To see this log correlation and exception tracking in action, open your browser and go to http://localhost:8000/users/999 to trigger the simulated error. The browser shows the fallback response: {"status": "error", "message": "Failed to fetch user"}.
Then, check your server’s terminal output. You’ll see how the request unfolded:

The info logs confirm that the request arrived and completed with a 200 OK response, because get_user() caught the exception and served a friendly error payload. The line that matters most for correlation is the error log:
ERROR:main:DB query failed for user 999. trace_id=xx..., span_id=xx...
This single line carries both IDs that you need. Copy the trace_id from your terminal and paste it into the search bar in your Jaeger UI. You’ll find the exact trace. The span_id from your log tells you which span within that trace emitted the message. Expand the trace to inspect the failing span:
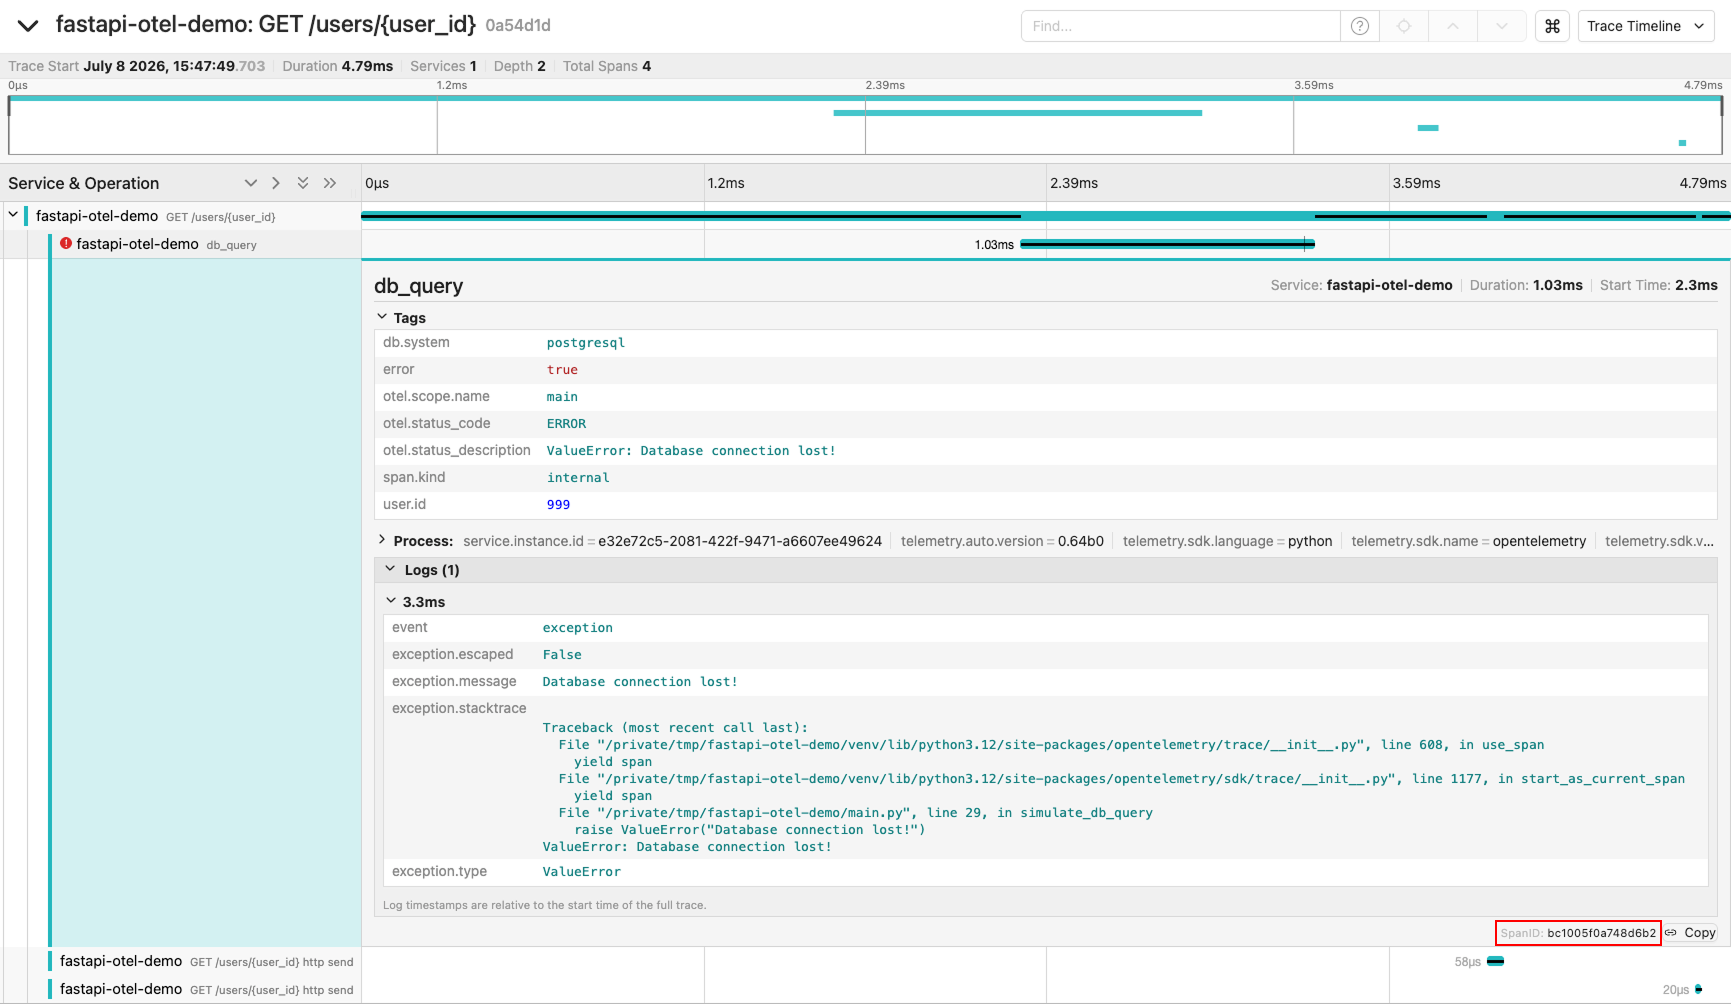
This seamless correlation between terminal logs and trace visualization is exactly what makes debugging in production so powerful.
Step 4: Configure Sampling to Manage Overhead
In a production environment, recording 100 percent of your traces can introduce significant CPU and network overhead. To prevent performance bottlenecks, you should configure a sampling strategy.
You can enable probability sampling without changing a single line of your Python code. Since environment variables are only read once at startup, the --reload flag won’t pick up this change. Stop your server manually and restart it with the sampler variables set:
$ OTEL_SERVICE_NAME="fastapi-otel-demo" \
  OTEL_METRICS_EXPORTER="none" \
  OTEL_TRACES_EXPORTER="otlp" \
  OTEL_EXPORTER_OTLP_ENDPOINT="http://localhost:4317" \
  OTEL_EXPORTER_OTLP_INSECURE="true" \
  OTEL_TRACES_SAMPLER="traceidratio" \
  OTEL_TRACES_SAMPLER_ARG="0.1" \
  opentelemetry-instrument python -m uvicorn main:app --reload
By adding traceidratio as your sampler and setting the argument to 0.1, you instruct OpenTelemetry to process only 10 percent of the incoming requests.
The traceidratio sampler makes its keep-or-drop decision based on the trace ID itself. Every span within a request shares the same trace ID, so a trace is either captured completely or not at all. You’ll never end up with a fragmented trace that’s missing half of its spans.
To see how this affects your application, send several requests to http://localhost:8000/users/1. You’ll see your formatted logs in the terminal for every request.
Next, open your Jaeger UI at http://localhost:16686 and verify that only about one in ten traces appears. This strategy effectively reduces the load on your observability backend while still providing enough data to monitor your application’s overall health.
Troubleshooting
While setting up OpenTelemetry and Jaeger, you might run into a few common issues. Keep these solutions in mind to quickly resolve them:
- No traces in the Jaeger UI: Ensure that the OTLP exporter is sending data to Jaeger’s OTLP receiver port (typically
4317for gRPC or4318for HTTP), not the web UI port (16686). - No
trace_idin terminal logs: Verify that you’re correctly extracting the OpenTelemetry context and initializing the logger after instrumentation is fully set up.
Most issues come down to a port mismatch or an initialization-order problem, so these two checks will clear up the majority of setup hiccups. With your telemetry pipeline running smoothly, you’re ready to review what you’ve built and where to go from here.
Next Steps
You now know how to integrate OpenTelemetry into a FastAPI application. In this tutorial, you configured auto-instrumentation, exported telemetry data to a Jaeger backend, created custom spans for your business logic, correlated your logs with traces, and optimized performance using trace sampling.
If you want to dive deeper into how standard logging behaves before you layer telemetry on top, then Real Python’s guide to logging in Python covers handlers, formatters, and log levels in depth. To explore more infrastructure and deployment topics to prepare your app for production, browse the DevOps tutorials.
For more advanced instrumentation techniques, consult the OpenTelemetry Python documentation. With these tools under your belt, you’re well equipped to diagnose system bottlenecks and track down elusive bugs across your backend services.
Get Your Code: Click here to download the free sample code you’ll use to instrument a FastAPI app with OpenTelemetry, exporting traces to a Jaeger backend, adding custom spans, correlating logs with traces, and tuning sampling.
Frequently Asked Questions
Now that you have some experience with OpenTelemetry and FastAPI in Python, you can use the questions and answers below to check your understanding and recap what you’ve learned.
These FAQs are related to the most important concepts you’ve covered in this tutorial. Click the Show/Hide toggle beside each question to reveal the answer.
The fastest way is auto-instrumentation. Install the opentelemetry-instrumentation-fastapi package and launch your app through the opentelemetry-instrument command-line tool, which reads your environment variables and wires up the tracing pipeline for you. This captures every HTTP request without adding any tracing code to your app.
Auto-instrumentation lets OpenTelemetry generate telemetry data for your app without any manual tracing code. A packaged agent hooks into your framework’s request handling at startup, so libraries like FastAPI get traced automatically. You add custom spans by hand only when you want visibility into your own business logic.
A trace tracks the complete journey of a request as it moves through your system, while a span represents a single unit of work within that trace. One trace usually holds many spans, such as a parent span for the overall request and nested spans for operations like a database query.
A trace ID identifies an entire request as it flows through your system, and every span in that request shares the same trace ID. A span ID identifies one specific unit of work inside the trace, so it changes from span to span. Including both in your logs lets your backend attach each log line to the exact operation that produced it.
OpenTelemetry collects and exports telemetry data from your application, but it doesn’t store or display that data on its own. Jaeger is a backend that receives the exported traces and provides a UI to search and visualize them. The two tools work together, with OpenTelemetry handling instrumentation and Jaeger handling storage and visualization.
Take the Quiz: Test your knowledge with our interactive “How to Integrate OpenTelemetry With a FastAPI App” quiz. You’ll receive a score upon completion to help you track your learning progress:
Interactive Quiz
How to Integrate OpenTelemetry With a FastAPI AppInstrument a FastAPI app with OpenTelemetry to export traces, add custom spans, and correlate your application logs with traces.