Data Science With Python Core Skills
Learning Path ⋅ Skills: Pandas, NumPy, Data Cleaning, Data Visualization
In this learning path you’ll cover a range of core skills that any Python data scientist worth their salt should know.
Additional Resources
Data Science With Python Core Skills
Learning Path ⋅ 15 Resources

Course
Using Jupyter Notebooks
Learn how to get started with the Jupyter Notebook, an open source web application that you can use to create and share documents that contain live code, equations, visualizations, and text.

Course
Explore Your Dataset With pandas
Learn how to start exploring a dataset with pandas and Python. You'll learn how to access specific rows and columns to answer questions about your data. You'll also see how to handle missing values and prepare to visualize your dataset in a Jupyter Notebook.
Course
Reading and Writing CSV Files
This short course covers how to read and write data to CSV files using Python's built in csv module and the pandas library. You'll learn how to handle standard and non-standard data such as CSV files without headers, or files containing delimeters in the data.
Course
Working With JSON in Python
Learn how to work with Python's built-in json module to serialize the data in your programs into JSON format. Then, you'll deserialize some JSON from an online API and convert it into Python objects.

Course
Pandas DataFrames 101
Learn the basics of working with the Data Frame data structure in Pandas. We will touch on how to create new columns from existing data, delete unneeded data, how to import data from a CSV file, and more.
Course
Python Plotting With Matplotlib
In this beginner-friendly course, you'll learn about plotting in Python with matplotlib by looking at the theory and following along with practical examples.
Course
Data Cleaning With pandas and NumPy
Learn how to clean up messy data using pandas and NumPy. You'll become equipped to deal with a range of problems, such as missing values, inconsistent formatting, malformed records, and nonsensical outliers.

Course
Idiomatic pandas: Tricks & Features You May Not Know
In this course you'll see how to use some lesser-used but idiomatic pandas capabilities that lend your code better readability, versatility, and speed.

Course
Interactive Data Visualization With Bokeh and Python
This course will get you up and running with Bokeh, using examples and a real-world dataset. You'll learn how to visualize your data, customize and organize your visualizations, and add interactivity.

Course
Histogram Plotting in Python: NumPy, Matplotlib, Pandas & Seaborn
In this course, you'll be equipped to make production-quality, presentation-ready Python histogram plots with a range of choices and features. It's your one-stop shop for constructing and manipulating histograms with Python's scientific stack.
Tutorial
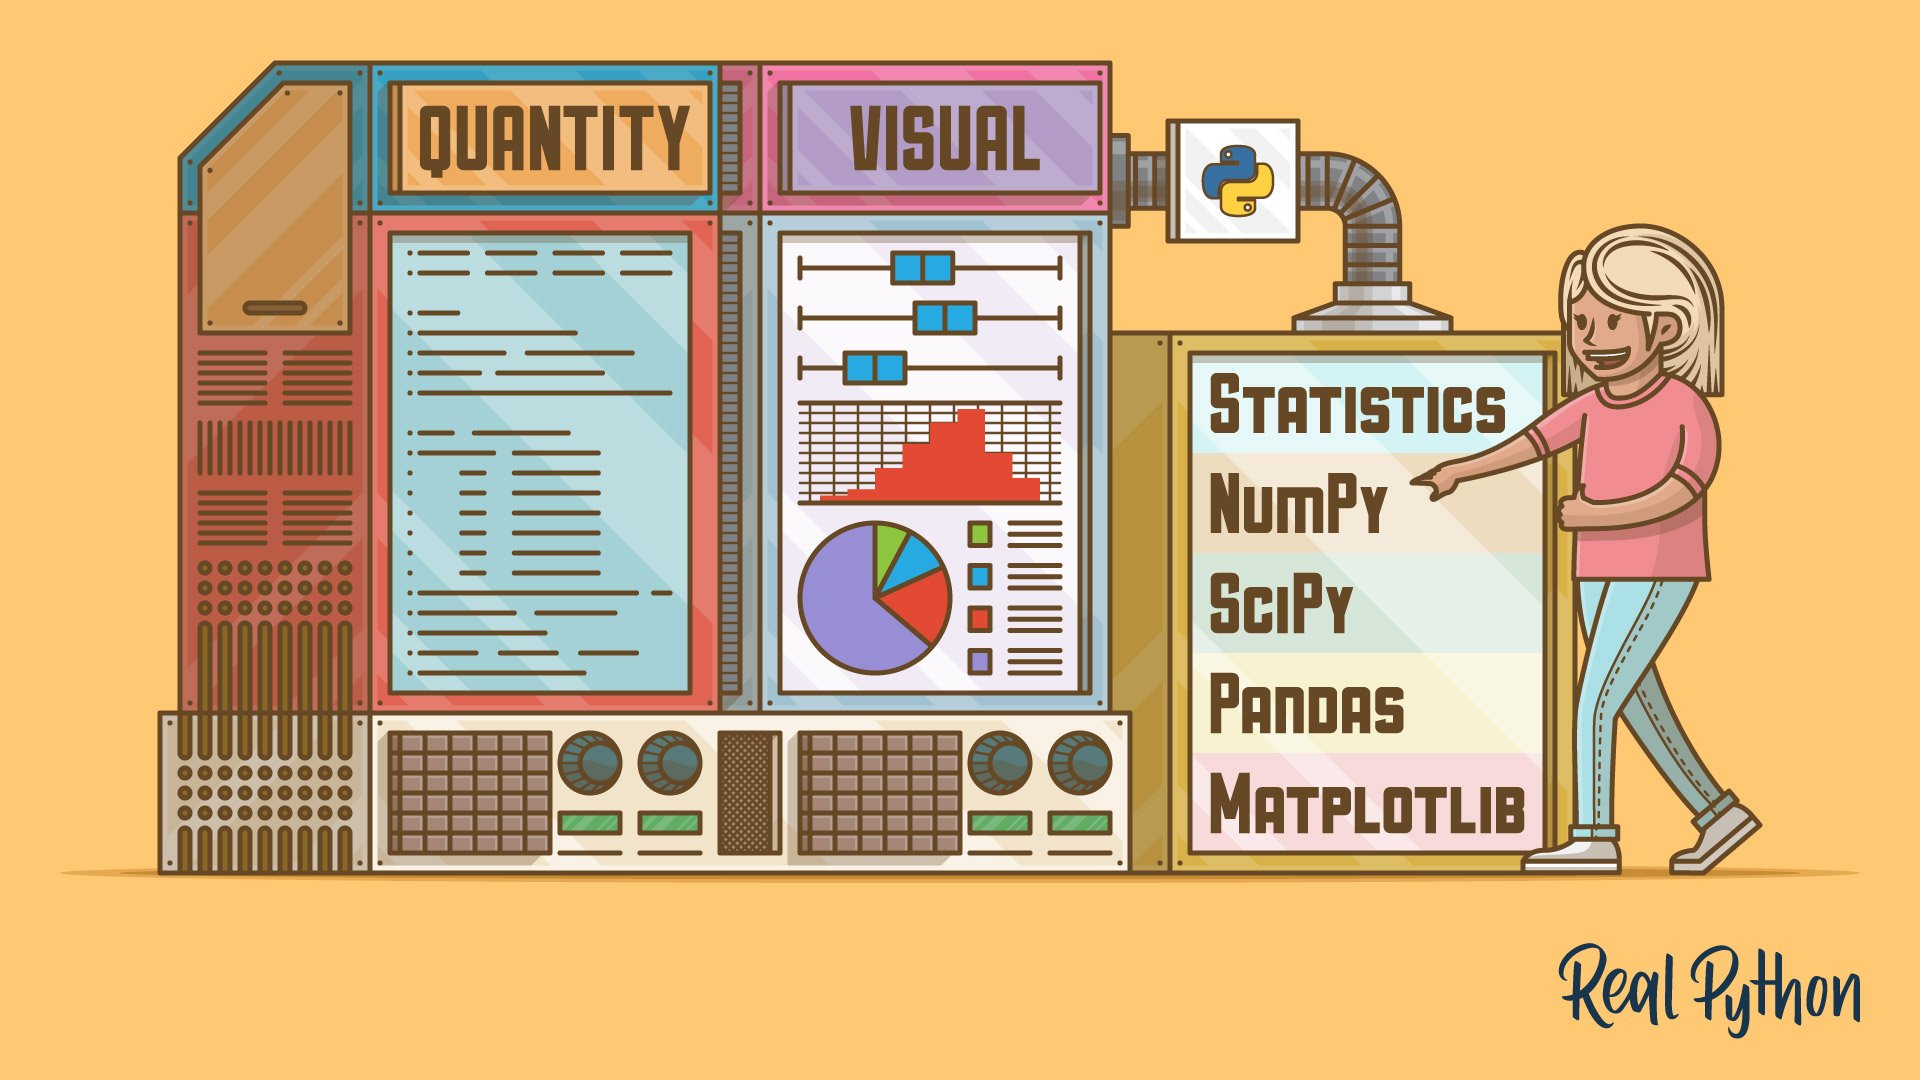
Python Statistics Fundamentals: How to Describe Your Data
Learn the fundamentals of descriptive statistics and how to calculate them in Python. You'll find out how to describe, summarize, and represent your data visually using NumPy, SciPy, pandas, Matplotlib, and the built-in Python statistics library.

Course
Generating Random Data in Python
See several options for generating random data in Python, and then build up to a comparison of each in terms of its level of security, versatility, purpose, and speed.
Tutorial
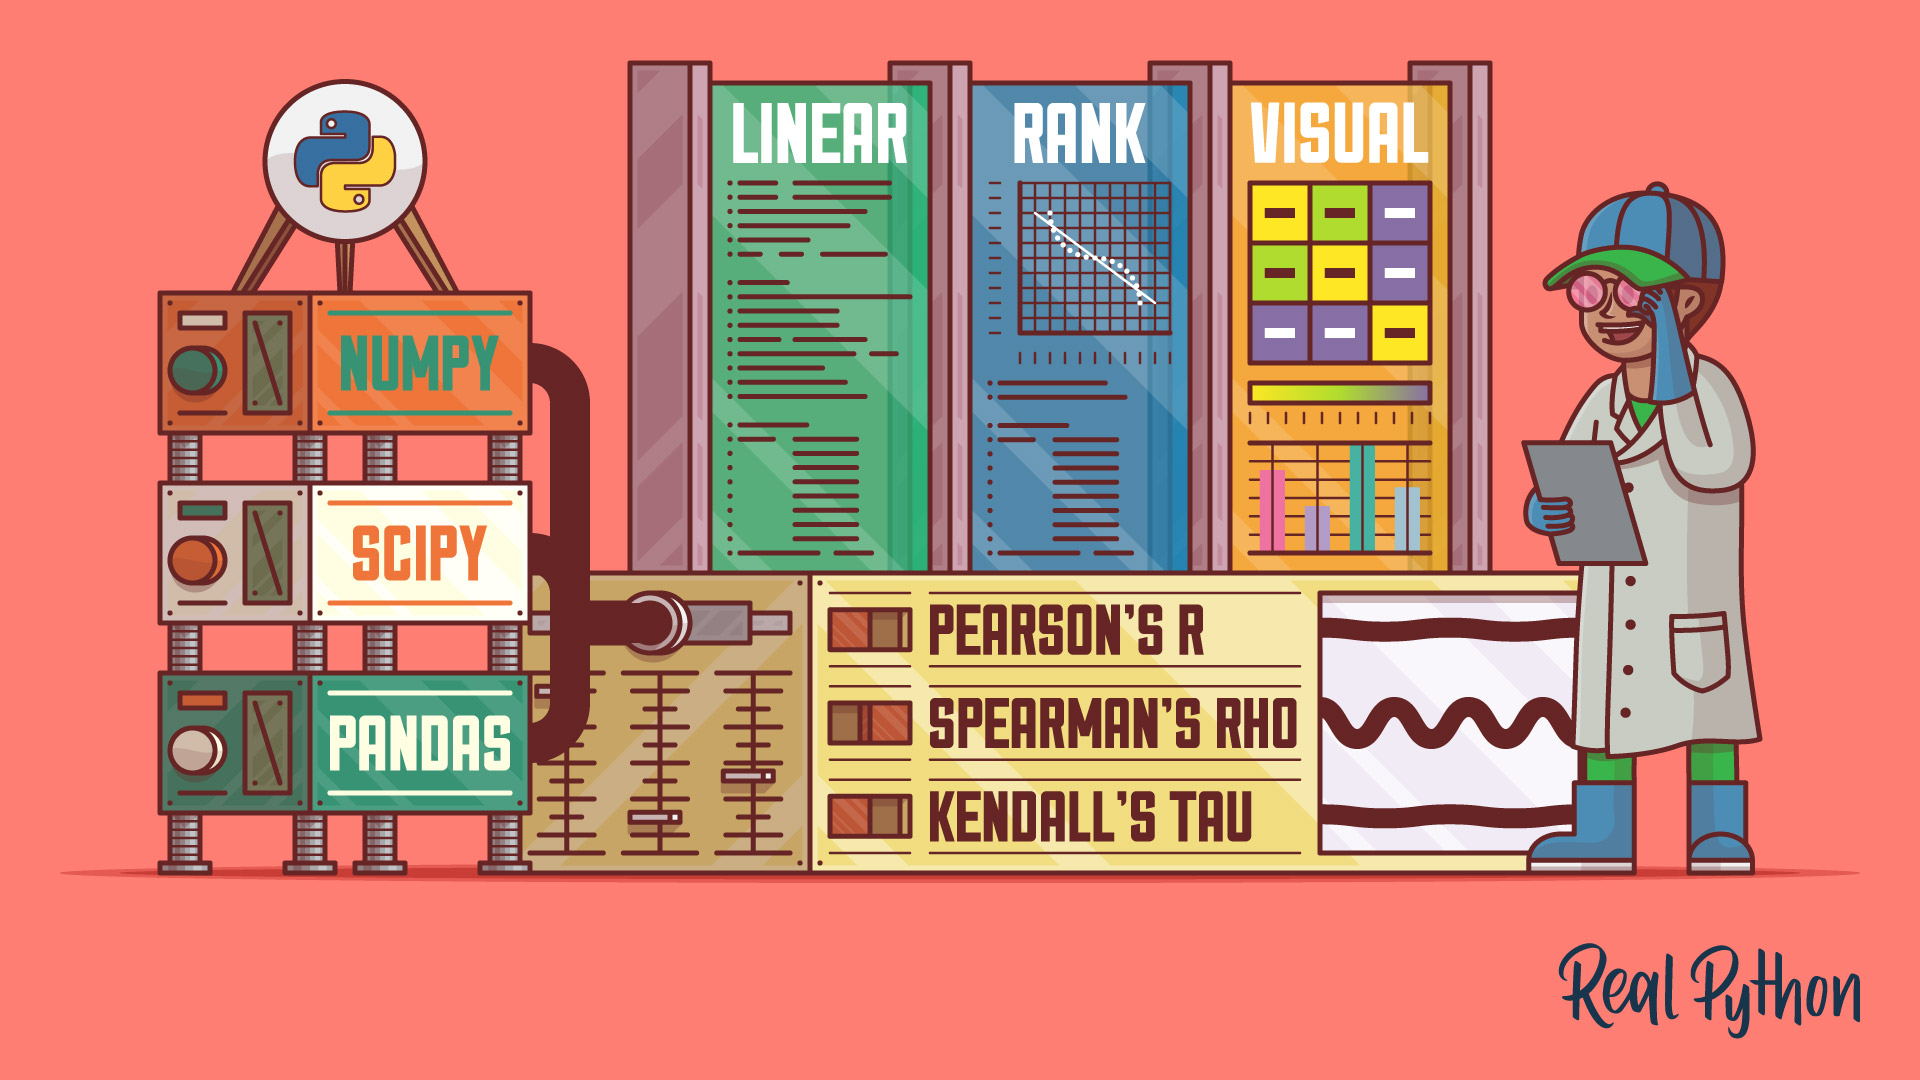
NumPy, SciPy, and pandas: Correlation With Python
Learn what correlation is and how you can calculate it with Python. You'll use SciPy, NumPy, and pandas correlation methods to calculate three different correlation coefficients. You'll also see how to visualize data, regression lines, and correlation matrices with Matplotlib.
Tutorial
Data Engineer Interview Questions With Python
This tutorial will prepare you for some common questions you'll encounter during your data engineer interview. You'll learn how to answer questions about databases, ETL pipelines, and big data workflows. You'll also take a look at SQL, NoSQL, and Redis use cases and query examples.

Tutorial
Look Ma, No for Loops: Array Programming With NumPy
How to take advantage of vectorization and broadcasting so you can use NumPy to its full capacity. In this tutorial you'll see step-by-step how these advanced features in NumPy help you writer faster code.
Got feedback on this learning path?
Looking for real-time conversation? Visit the Real Python Community Chat or join the next “Office Hours” Live Q&A Session. Happy Pythoning!