Dash is a popular Python framework for creating interactive data visualization interfaces. With Dash, you build web applications using only Python, without needing advanced web development skills. It integrates seamlessly with technologies like Flask, React.js, and Plotly.js to render user interfaces and generate charts.
By the end of this tutorial, you’ll understand that:
- Dash is an open-source framework for building data visualization interfaces using Python.
- Good use cases for Dash include interactive dashboards for data analysis and visualization tasks.
- You can customize the style of a Dash app using CSS, either inline or with external files.
- You can deploy Dash applications on PythonAnywhere, a platform offering free hosting for Python web apps.
Dash gives data scientists the ability to showcase their results in interactive web applications. You don’t need to be an expert in web development. In this tutorial, you’ll explore how to create, style, and deploy a Dash application, transforming a basic dashboard into a fully interactive tool.
You can download the source code, data, and resources for the sample application that you’ll make in this tutorial by clicking the link below:
Get the Source Code: Click here to get the source code you’ll use to learn about creating data visualization interfaces in Python with Dash in this tutorial.
Take the Quiz: Test your knowledge with our interactive “Develop Data Visualization Interfaces in Python With Dash” quiz. You’ll receive a score upon completion to help you track your learning progress:

Interactive Quiz
Develop Data Visualization Interfaces in Python With DashTest your understanding of building interactive Python dashboards with Dash, including layout, styling, callbacks, and deployment.
What Is Dash?
Dash is an open-source framework for building data visualization interfaces. Released in 2017 as a Python library, it’s grown to include implementations for R, Julia, and F#. Dash helps data scientists build analytical web applications without requiring advanced web development knowledge.
Three technologies constitute the core of Dash:
- Flask supplies the web server functionality.
- React.js renders the user interface of the web page.
- Plotly.js generates the charts used in your application.
But you don’t have to worry about making all these technologies work together. Dash will do that for you. You just need to write Python, R, Julia, or F# and sprinkle in a bit of CSS.
Plotly, a Canada-based company, built Dash and supports its development. You may know the company from the popular graphing libraries that share its name. The company released Dash as open source under an MIT license, so you can use Dash at no cost.
Plotly also offers a commercial companion to Dash called Dash Enterprise. This paid service provides companies with support services such as hosting, deploying, and handling authentication on Dash applications. But these features live outside of Dash’s open-source ecosystem.
Dash will help you build dashboards quickly. If you’re used to analyzing data or building data visualizations using Python, then Dash will be a useful addition to your toolbox. Here are a few examples of what you can make with Dash:
- A dashboard showing object detection for self-driving cars
- A visualization of millions of Uber rides
- An interactive tool for analyzing soccer match data
This is just a tiny sample. If you’d like to see other interesting use cases, then go check out the Dash App Gallery.
Note: You don’t need advanced knowledge of web development to follow this tutorial, but some familiarity with HTML and CSS won’t hurt.
You should know the basics of the following topics, though:
- Python graphing libraries such as Plotly, Bokeh, and Matplotlib
- HTML and the structure of an HTML file
- CSS and style sheets
If you feel comfortable with the requirements and want to learn how to use Dash in your next project, then continue to the following section!
Get Started With Dash in Python
In this tutorial, you’ll go through the end-to-end process of building a dashboard using Dash. If you follow along with the examples, then you’ll go from a bare-bones dashboard on your local machine to a styled dashboard deployed on PythonAnywhere.
To build the dashboard, you’ll use a dataset of sales and prices of avocados in the United States between 2015 and 2018. Justin Kiggins compiled this dataset using data from the Hass Avocado Board.
How to Set Up Your Local Environment
To develop your app, you’ll need a new directory to store your code and data. You’ll also need a clean Python virtual environment. To create those, execute the commands below, choosing the version that matches your operating system:
The first two commands create a directory for your project and move your current location there. The next command creates a virtual environment in that location. The last command activates the virtual environment.
Next, you need to install the required libraries. You can do that using pip inside your virtual environment. Install the libraries as follows:
(venv) $ python -m pip install dash==2.8.1 pandas==1.5.3
This command will install Dash and pandas in your virtual environment. You’ll use specific versions of these packages to make sure that you have the same environment as the one used throughout this tutorial. Alongside Dash, pandas will help you handle reading and wrangling the data that you’ll use in your app.
Note: Version 2 of Dash was released in the fall of 2021. This version is mostly backward compatible, but if you’ve used Dash 1 earlier then you’ll notice that some idioms and recommendations have changed.
Finally, you need some data to feed into your dashboard. You can download the data as well as the code you see throughout this tutorial by clicking the link below:
Get the Source Code: Click here to get the source code you’ll use to learn about creating data visualization interfaces in Python with Dash in this tutorial.
Save the data as avocado.csv in the root directory of the project. By now, you should have a virtual environment with the required libraries and the data in the root folder of your project. Your project’s structure should look like this:
avocado_analytics/
|
├── venv/
|
└── avocado.csv
You’re good to go! Next, you’ll build your first Dash application.
How to Build a Dash Application
For development purposes, it’s useful to think of the process of building a Dash application in three steps:
- Define the content of your application using the app’s layout.
- Style the looks of your app with CSS or styled components.
- Use callbacks to determine which parts of your app are interactive and what they react to.
In this section, you’ll learn about the layout. Next, you’ll learn about style, and in a later section, you’ll learn how to make your dashboard interactive. You’ll start by setting up everything you need to initialize your application, and then you’ll define the layout of your app.
Initializing Your Dash Application
Create an empty file named app.py in the root directory of your project, then review the code of app.py in this section. To make it easier for you to copy the full code, you’ll find the entire contents of app.py at the end of this section.
Here are the first few lines of app.py:
app.py
 1import pandas as pd
 2from dash import Dash, dcc, html
 3
 4data = (
 5    pd.read_csv("avocado.csv")
 6    .query("type == 'conventional' and region == 'Albany'")
 7    .assign(Date=lambda data: pd.to_datetime(data["Date"], format="%Y-%m-%d"))
 8    .sort_values(by="Date")
 9)
10
11app = Dash(__name__)
On lines 1 and 2, you import the required libraries: pandas and dash. You’ll use pandas to read and organize the data. You’re importing the following elements from dash:
Dashhelps you initialize your application.html, also called Dash HTML Components, lets you access HTML tags.dcc, short for Dash Core Components, allows you to create interactive components like graphs, dropdowns, or date ranges.
On lines 4 to 9, you read the data and preprocess it for use in the dashboard. You filter some of the data because your dashboard isn’t interactive yet, and the plotted values wouldn’t make sense otherwise.
On line 11, you create an instance of the Dash class. If you’ve used Flask before, then initializing a Dash class may look familiar. In Flask, you usually initialize a WSGI application using Flask(__name__). Similarly, for a Dash app, you use Dash(__name__).
Defining the Layout of Your Dash Application
Next, you’ll define the layout property of your application. This property dictates the content of your app. In this case, you’ll use a heading with a description immediately below it, followed by two graphs. Here’s how you define it:
app.py
 1# ...
 2
 3app.layout = html.Div(
 4    children=[
 5        html.H1(children="Avocado Analytics"),
 6        html.P(
 7            children=(
 8                "Analyze the behavior of avocado prices and the number"
 9                " of avocados sold in the US between 2015 and 2018"
10            ),
11        ),
12        dcc.Graph(
13            figure={
14                "data": [
15                    {
16                        "x": data["Date"],
17                        "y": data["AveragePrice"],
18                        "type": "lines",
19                    },
20                ],
21                "layout": {"title": "Average Price of Avocados"},
22            },
23        ),
24        dcc.Graph(
25            figure={
26                "data": [
27                    {
28                        "x": data["Date"],
29                        "y": data["Total Volume"],
30                        "type": "lines",
31                    },
32                ],
33                "layout": {"title": "Avocados Sold"},
34            },
35        ),
36    ]
37)
With this code, you define the .layout property of the app object. This property determines the content of your application using a tree structure made of Dash components.
Dash components come prepackaged in Python libraries. Some of them come with Dash when you install it. You have to install the rest separately. You’ll see two sets of components in almost every app:
- The Dash HTML Components module provides you with Python wrappers for HTML elements. For example, you could use Dash HTML Components to create elements such as paragraphs, headings, or lists.
- The Dash Core Components module provides you with Python abstractions for creating interactive user interfaces. You can use these components to create interactive elements such as graphs, sliders, or dropdowns.
On lines 3 to 11, you can see the Dash HTML components in practice. You start by defining the parent component, html.Div. Then you add two more elements, a heading (html.H1) and a paragraph (html.P), as its children.
These components are equivalent to the <div>, <h1>, and <p> HTML tags. You can use the components’ arguments to modify attributes or the content of the tags. For example, to specify what goes inside the <div> tag, you use the children argument in html.Div.
There are also other arguments in the components, such as style, className, and id, that refer to attributes of the HTML tags. You’ll see how to use some of these properties to style your dashboard in the next section.
The part of the layout shown on lines 3 to 11 will get transformed into the following HTML code:
<div>
  <h1>Avocado Analytics</h1>
  <p>
    Analyze the behavior of avocado prices and the number
    of avocados sold in the US between 2015 and 2018
  </p>
  <!-- Rest of the app -->
</div>
This HTML code is rendered when you open your application in the browser. It follows the same structure as your Python code, with a <div> tag containing an <h1> and a <p> element.
On lines 12 and 24 in the layout code snippet, you can see the graph component from Dash Core Components in practice. There are two dcc.Graph components in app.layout. The first one plots the average prices of avocados during the period of study, and the second plots the number of avocados sold in the United States during the same period.
Under the hood, Dash uses Plotly.js to generate graphs. The dcc.Graph components expect a figure object or a Python dictionary containing the plot’s data and layout. In this case, you provide the latter.
Finally, these two lines of code help you run your application:
app.py
# ...

if __name__ == "__main__":
    app.run_server(debug=True)
This name-main idiom allows you to run your Dash application locally using Flask’s built-in server. The debug=True parameter enables the hot-reloading option in your application. This means that when you make a change to your app, it reloads automatically, without you having to restart the server.
You can expand the following box to see the complete source code in one listing:
app.py
import pandas as pd
from dash import Dash, dcc, html

data = (
    pd.read_csv("avocado.csv")
    .query("type == 'conventional' and region == 'Albany'")
    .assign(Date=lambda data: pd.to_datetime(data["Date"], format="%Y-%m-%d"))
    .sort_values(by="Date")
)

app = Dash(__name__)

app.layout = html.Div(
    children=[
        html.H1(children="Avocado Analytics"),
        html.P(
            children=(
                "Analyze the behavior of avocado prices and the number"
                " of avocados sold in the US between 2015 and 2018"
            ),
        ),
        dcc.Graph(
            figure={
                "data": [
                    {
                        "x": data["Date"],
                        "y": data["AveragePrice"],
                        "type": "lines",
                    },
                ],
                "layout": {"title": "Average Price of Avocados"},
            },
        ),
        dcc.Graph(
            figure={
                "data": [
                    {
                        "x": data["Date"],
                        "y": data["Total Volume"],
                        "type": "lines",
                    },
                ],
                "layout": {"title": "Avocados Sold"},
            },
        ),
    ]
)

if __name__ == "__main__":
    app.run_server(debug=True)
This is the code for your bare-bones dashboard. It includes all the snippets of code that you reviewed earlier in this section.
Now it’s time to run your application. Open a terminal inside your project’s root directory with the project’s virtual environment activated. Run python app.py, then go to http://localhost:8050 using your preferred browser.
It’s ALIVE! Your dashboard should look like this:
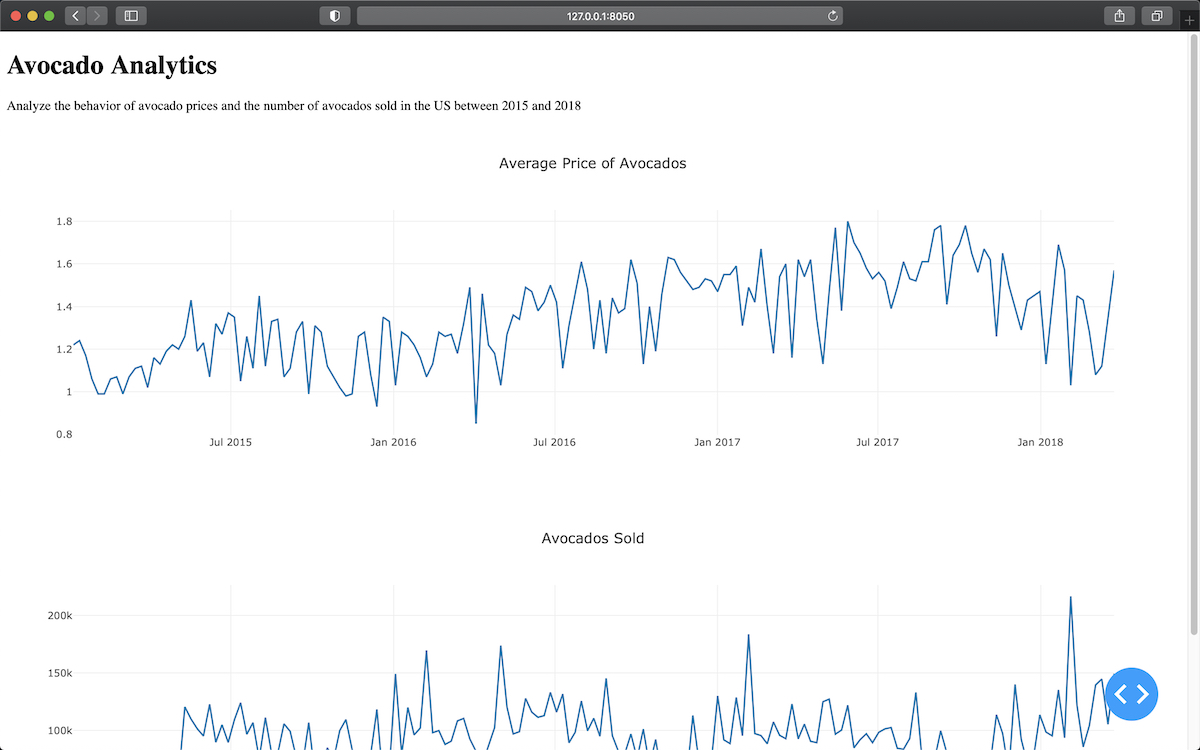
The good news is that you now have a working version of your dashboard. The bad news is that there’s still some work to do before you can show this to others. The dashboard is far from visually pleasing, and you still need to add some interactivity to it.
But don’t worry—you’ll learn how to fix these issues in the next sections.
Style Your Dash Application
Dash provides you with a lot of flexibility to customize the look of your application. You can use your own CSS or JavaScript files, set a favicon—the small icon shown on tabs in the web browser—and embed images, among other advanced options.
Note: In this tutorial, you’ll see how to show off your own style with CSS. There are several packages on PyPI that provide styled Dash components. For example, dash-bootstrap-components are Bootstrap themed.
In this section, you’ll learn how to apply custom styles to components, and then you’ll style the dashboard that you built in the previous section.
How to Apply a Custom Style to Your Components
You can style components in two ways:
- Using the
styleargument of individual components - Providing an external CSS file
Using the style argument to customize your dashboard is straightforward. This argument takes a Python dictionary with key-value pairs consisting of the names of CSS properties and the values that you want to set.
Note: When specifying CSS properties in the style argument, you should use mixedCase syntax instead of hyphen-separated words. For example, to change the background color of an element, you should use backgroundColor and not background-color.
If you wanted to change the size and color of the H1 element in app.py, then you could set the element’s style argument as follows:
html.H1(
    children="Avocado Analytics",
    style={"fontSize": "48px", "color": "red"},
),
Here, you provide to style a dictionary with the properties and the corresponding values that you want to set. In this case, the specified style is to have a red heading with a font size of 48 pixels.
The downside of using the style argument is that it doesn’t scale well as your codebase grows. If your dashboard has multiple components that you want to look the same, then you’ll end up repeating a lot of your code. Instead, you can use a custom CSS file.
If you want to include your own local CSS or JavaScript files, then you need to create a folder called assets/ in the root directory of your project and save the files that you want to add there. By default, Dash automatically serves any file included in assets/. This will also work for adding a favicon or embedding images, as you’ll see in a bit.
Then you can use the className or id arguments of the components to adjust their styles using CSS. These arguments correspond with the class and id attributes when they’re transformed into HTML tags.
If you wanted to adjust the font size and text color of the H1 element in app.py, then you could use the className argument as follows:
html.H1(
    children="Avocado Analytics",
    className="header-title",
),
Setting the className argument will define the class attribute for the <h1> element. You could then use a CSS file in the assets folder to specify how you want it to look:
.header-title {
  font-size: 48px;
  color: red;
}
You use a class selector to format the heading in your CSS file. This selector will adjust the heading format. You could also use it with another element that needs to share the format by setting className="header-title".
Next, you’ll style your dashboard.
How to Improve the Looks of Your Dashboard
You just covered the basics of styling in Dash. Now, you’ll learn how to customize your dashboard’s looks. You’ll make these improvements:
- Add a favicon and title to the page.
- Change the font family of your dashboard.
- Use an external CSS file to style Dash components.
You’ll start by learning how to use external assets in your application. That’ll allow you to add a favicon, a custom font family, and a CSS style sheet. Then you’ll learn how to use the className argument to apply custom styles to your Dash components.
Adding External Assets to Your Application
Create a folder called assets/ in your project’s root directory. Download a favicon from the Twemoji open-source project and save it as favicon.ico in assets/. Finally, create a CSS file in assets/ called style.css and add the code in the collapsible section below:
assets/style.css
body {
    font-family: "Lato", sans-serif;
    margin: 0;
    background-color: #F7F7F7;
}

.header {
    background-color: #222222;
    height: 256px;
    display: flex;
    flex-direction: column;
    justify-content: center;
}

.header-emoji {
    font-size: 48px;
    margin: 0 auto;
    text-align: center;
}

.header-title {
    color: #FFFFFF;
    font-size: 48px;
    font-weight: bold;
    text-align: center;
    margin: 0 auto;
}

.header-description {
    color: #CFCFCF;
    margin: 4px auto;
    text-align: center;
    max-width: 384px;
}

.wrapper {
    margin-right: auto;
    margin-left: auto;
    max-width: 1024px;
    padding-right: 10px;
    padding-left: 10px;
    margin-top: 32px;
}

.card {
    margin-bottom: 24px;
    box-shadow: 0 4px 6px 0 rgba(0, 0, 0, 0.18);
}
The assets/style.css file contains the styles that you’ll apply to components in your application’s layout. By now, your project structure should look like this:
avocado_analytics/
│
├── assets/
│   ├── favicon.ico
│   └── style.css
│
├── venv/
│
├── app.py
└── avocado.csv
Once you start the server, Dash will automatically serve the files located in assets/. You include two files, favicon.ico and style.css, in assets/. To set a default favicon, you don’t have to take any additional steps. To use the styles that you defined in style.css, you’ll need to use the className argument in Dash components.
You need to make a few changes in app.py. You’ll include an external style sheet, add a title to your dashboard, and style the components using the style.css file. Review the changes below. Then, in the last part of this section, you’ll find the full code for your updated version of app.py.
Here’s how you include an external style sheet and add a title to your dashboard:
app.py
# ...

external_stylesheets = [
    {
        "href": (
            "https://fonts.googleapis.com/css2?"
            "family=Lato:wght@400;700&display=swap"
        ),
        "rel": "stylesheet",
    },
]
app = dash.Dash(__name__, external_stylesheets=external_stylesheets)
app.title = "Avocado Analytics: Understand Your Avocados!"

# ...
In these code lines, you specify an external CSS file containing a font family, which you want to load in your application. You add external files to the head tag of your application, so they load before the body of your application loads. You use the external_stylesheets argument for adding external CSS files or external_scripts for external JavaScript files like Google Analytics.
You also set the title of your application. This is the text that appears in the title bar of your web browser, in Google’s search results, and in social media cards when you share your site.
Customizing the Styles of Components
To use the styles in style.css, you’ll need to use the className argument in Dash components. The code below adds a className with a corresponding class selector to each of the components in the header of your dashboard:
app.py
# ...

app.layout = html.Div(
    children=[
        html.Div(
            children=[
                html.P(children="🥑", className="header-emoji"),
                html.H1(
                    children="Avocado Analytics", className="header-title"
                ),
                html.P(
                    children=(
                        "Analyze the behavior of avocado prices and the number"
                        " of avocados sold in the US between 2015 and 2018"
                    ),
                    className="header-description",
                ),
            ],
            className="header",

        # ...
In the highlighted lines, you can see that you’ve made three changes to the initial version of the dashboard:
- There’s a new
<div>element that wraps all the header components. - There’s a new paragraph element with an avocado emoji, 🥑, that’ll serve as a logo on the page.
- There’s a
classNameargument in each component. These class names match a class selector instyle.css, which defines the looks of each component.
For example, the header-description class assigned to the paragraph component starting with "Analyze the behavior of avocado prices" has a corresponding selector in style.css. In that file, you’ll see the following:
.header-description {
    color: #CFCFCF;
    margin: 4px auto;
    text-align: center;
    max-width: 384px;
}
These lines define the format for the header-description class selector. They’ll change the color, margin, alignment, and maximum width of any component with className="header-description". All the components have corresponding class selectors in the CSS file.
The other significant change is in the graphs. Here’s the new code for the price chart:
app.py
 1# ...
 2
 3app.layout = html.Div(
 4    children=[
 5        # ...
 6
 7        html.Div(
 8            children=[
 9                html.Div(
10                    children=dcc.Graph(
11                        id="price-chart",
12                        config={"displayModeBar": False},
13                        figure={
14                            "data": [
15                                {
16                                    "x": data["Date"],
17                                    "y": data["AveragePrice"],
18                                    "type": "lines",
19                                    "hovertemplate": (
20                                        "$%{y:.2f}<extra></extra>"
21                                    ),
22                                },
23                            ],
24                            "layout": {
25                                "title": {
26                                    "text": "Average Price of Avocados",
27                                    "x": 0.05,
28                                    "xanchor": "left",
29                                },
30                                "xaxis": {"fixedrange": True},
31                                "yaxis": {
32                                    "tickprefix": "$",
33                                    "fixedrange": True,
34                                },
35                                "colorway": ["#17b897"],
36                            },
37                        },
38                    ),
39                    className="card",
40                ),
41
42                # ...
43
44            ],
45            className="wrapper",
46        ),
47    ]
48)
49
50# ...
In this code, you define a className and a few customizations for the config and figure parameters of your chart. Here are the changes:
- Line 12: You remove the floating toolbar that Plotly shows by default.
- Lines 19 to 21: You set the hover template so that when users hover over a data point, it shows the price in dollars. Instead of
2.5, it’ll show as$2.5. - Lines 24 to 36: You adjust the axes, the color of the figure, and the title format in the layout section of the graph.
- Lines 9 and 39: You wrap the graph in a
<div>element with a"card"class. This will give the graph a white background and add a small shadow below it. - Lines 7 and 45: You add a
<div>element that wraps the graph components with awrapperclass.
There are similar adjustments to the sales and volume charts. You can see those in the full code for the updated app.py in the collapsible section below:
app.py
import pandas as pd
from dash import Dash, dcc, html

data = (
    pd.read_csv("avocado.csv")
    .query("type == 'conventional' and region == 'Albany'")
    .assign(Date=lambda data: pd.to_datetime(data["Date"], format="%Y-%m-%d"))
    .sort_values(by="Date")
)

external_stylesheets = [
    {
        "href": (
            "https://fonts.googleapis.com/css2?"
            "family=Lato:wght@400;700&display=swap"
        ),
        "rel": "stylesheet",
    },
]
app = Dash(__name__, external_stylesheets=external_stylesheets)
app.title = "Avocado Analytics: Understand Your Avocados!"

app.layout = html.Div(
    children=[
        html.Div(
            children=[
                html.P(children="🥑", className="header-emoji"),
                html.H1(
                    children="Avocado Analytics", className="header-title"
                ),
                html.P(
                    children=(
                        "Analyze the behavior of avocado prices and the number"
                        " of avocados sold in the US between 2015 and 2018"
                    ),
                    className="header-description",
                ),
            ],
            className="header",
        ),
        html.Div(
            children=[
                html.Div(
                    children=dcc.Graph(
                        id="price-chart",
                        config={"displayModeBar": False},
                        figure={
                            "data": [
                                {
                                    "x": data["Date"],
                                    "y": data["AveragePrice"],
                                    "type": "lines",
                                    "hovertemplate": (
                                        "$%{y:.2f}<extra></extra>"
                                    ),
                                },
                            ],
                            "layout": {
                                "title": {
                                    "text": "Average Price of Avocados",
                                    "x": 0.05,
                                    "xanchor": "left",
                                },
                                "xaxis": {"fixedrange": True},
                                "yaxis": {
                                    "tickprefix": "$",
                                    "fixedrange": True,
                                },
                                "colorway": ["#17b897"],
                            },
                        },
                    ),
                    className="card",
                ),
                html.Div(
                    children=dcc.Graph(
                        id="volume-chart",
                        config={"displayModeBar": False},
                        figure={
                            "data": [
                                {
                                    "x": data["Date"],
                                    "y": data["Total Volume"],
                                    "type": "lines",
                                },
                            ],
                            "layout": {
                                "title": {
                                    "text": "Avocados Sold",
                                    "x": 0.05,
                                    "xanchor": "left",
                                },
                                "xaxis": {"fixedrange": True},
                                "yaxis": {"fixedrange": True},
                                "colorway": ["#E12D39"],
                            },
                        },
                    ),
                    className="card",
                ),
            ],
            className="wrapper",
        ),
    ]
)

if __name__ == "__main__":
    app.run_server(debug=True)
This is the updated version of app.py. It has the required changes in the code to add a favicon and a page title, update the font family, and use an external CSS file. After these changes, your dashboard should look like this:

In the next section, you’ll learn how to add interactive components to your dashboard.
Add Interactivity to Your Dash Apps Using Callbacks
In this section, you’ll learn how to add interactive elements to your dashboard.
Dash’s interactivity is based on a reactive programming paradigm. This means that you can link components with elements of your app that you want to update. If a user interacts with an input component like a dropdown or a range slider, then the output, such as a graph, will react automatically to the changes in the input.
Now you’re going to make your dashboard interactive. This new version of your dashboard will allow the user to interact with the following filters:
- Region
- Type of avocado
- Date range
The collapsible boxes below contain the full source code that you’ll be exploring in this section. Start by replacing your local app.py with the new version in the collapsible section below:
app.py
import pandas as pd
from dash import Dash, Input, Output, dcc, html

data = (
    pd.read_csv("avocado.csv")
    .assign(Date=lambda data: pd.to_datetime(data["Date"], format="%Y-%m-%d"))
    .sort_values(by="Date")
)
regions = data["region"].sort_values().unique()
avocado_types = data["type"].sort_values().unique()

external_stylesheets = [
    {
        "href": (
            "https://fonts.googleapis.com/css2?"
            "family=Lato:wght@400;700&display=swap"
        ),
        "rel": "stylesheet",
    },
]
app = Dash(__name__, external_stylesheets=external_stylesheets)
app.title = "Avocado Analytics: Understand Your Avocados!"

app.layout = html.Div(
    children=[
        html.Div(
            children=[
                html.P(children="🥑", className="header-emoji"),
                html.H1(
                    children="Avocado Analytics", className="header-title"
                ),
                html.P(
                    children=(
                        "Analyze the behavior of avocado prices and the number"
                        " of avocados sold in the US between 2015 and 2018"
                    ),
                    className="header-description",
                ),
            ],
            className="header",
        ),
        html.Div(
            children=[
                html.Div(
                    children=[
                        html.Div(children="Region", className="menu-title"),
                        dcc.Dropdown(
                            id="region-filter",
                            options=[
                                {"label": region, "value": region}
                                for region in regions
                            ],
                            value="Albany",
                            clearable=False,
                            className="dropdown",
                        ),
                    ]
                ),
                html.Div(
                    children=[
                        html.Div(children="Type", className="menu-title"),
                        dcc.Dropdown(
                            id="type-filter",
                            options=[
                                {
                                    "label": avocado_type.title(),
                                    "value": avocado_type,
                                }
                                for avocado_type in avocado_types
                            ],
                            value="organic",
                            clearable=False,
                            searchable=False,
                            className="dropdown",
                        ),
                    ],
                ),
                html.Div(
                    children=[
                        html.Div(
                            children="Date Range", className="menu-title"
                        ),
                        dcc.DatePickerRange(
                            id="date-range",
                            min_date_allowed=data["Date"].min().date(),
                            max_date_allowed=data["Date"].max().date(),
                            start_date=data["Date"].min().date(),
                            end_date=data["Date"].max().date(),
                        ),
                    ]
                ),
            ],
            className="menu",
        ),
        html.Div(
            children=[
                html.Div(
                    children=dcc.Graph(
                        id="price-chart",
                        config={"displayModeBar": False},
                    ),
                    className="card",
                ),
                html.Div(
                    children=dcc.Graph(
                        id="volume-chart",
                        config={"displayModeBar": False},
                    ),
                    className="card",
                ),
            ],
            className="wrapper",
        ),
    ]
)

@app.callback(
    Output("price-chart", "figure"),
    Output("volume-chart", "figure"),
    Input("region-filter", "value"),
    Input("type-filter", "value"),
    Input("date-range", "start_date"),
    Input("date-range", "end_date"),
)
def update_charts(region, avocado_type, start_date, end_date):
    filtered_data = data.query(
        "region == @region and type == @avocado_type"
        " and Date >= @start_date and Date <= @end_date"
    )
    price_chart_figure = {
        "data": [
            {
                "x": filtered_data["Date"],
                "y": filtered_data["AveragePrice"],
                "type": "lines",
                "hovertemplate": "$%{y:.2f}<extra></extra>",
            },
        ],
        "layout": {
            "title": {
                "text": "Average Price of Avocados",
                "x": 0.05,
                "xanchor": "left",
            },
            "xaxis": {"fixedrange": True},
            "yaxis": {"tickprefix": "$", "fixedrange": True},
            "colorway": ["#17B897"],
        },
    }

    volume_chart_figure = {
        "data": [
            {
                "x": filtered_data["Date"],
                "y": filtered_data["Total Volume"],
                "type": "lines",
            },
        ],
        "layout": {
            "title": {"text": "Avocados Sold", "x": 0.05, "xanchor": "left"},
            "xaxis": {"fixedrange": True},
            "yaxis": {"fixedrange": True},
            "colorway": ["#E12D39"],
        },
    }
    return price_chart_figure, volume_chart_figure

if __name__ == "__main__":
    app.run_server(debug=True)
Next, replace style.css with the code in the collapsible section below:
assets/style.css
body {
    font-family: "Lato", sans-serif;
    margin: 0;
    background-color: #F7F7F7;
}

.header {
    background-color: #222222;
    height: 288px;
    padding: 16px 0 0 0;
}

.header-emoji {
    font-size: 48px;
    margin: 0 auto;
    text-align: center;
}

.header-title {
    color: #FFFFFF;
    font-size: 48px;
    font-weight: bold;
    text-align: center;
    margin: 0 auto;
}

.header-description {
    color: #CFCFCF;
    margin: 4px auto;
    text-align: center;
    max-width: 384px;
}

.wrapper {
    margin-right: auto;
    margin-left: auto;
    max-width: 1024px;
    padding-right: 10px;
    padding-left: 10px;
    margin-top: 32px;
}

.card {
    margin-bottom: 24px;
    box-shadow: 0 4px 6px 0 rgba(0, 0, 0, 0.18);
}

.menu {
    height: 112px;
    width: 912px;
    display: flex;
    justify-content: space-evenly;
    padding-top: 24px;
    margin: -80px auto 0 auto;
    background-color: #FFFFFF;
    box-shadow: 0 4px 6px 0 rgba(0, 0, 0, 0.18);
}

.Select-control {
    width: 256px;
    height: 48px;
}

.Select--single>.Select-control .Select-value,
.Select-placeholder {
    line-height: 48px;
}

.Select--multi .Select-value-label {
    line-height: 32px;
}

.menu-title {
    margin-bottom: 6px;
    font-weight: bold;
    color: #079A82;
}
Now you’re ready to explore the interactive components that you’ve added to your application!
How to Create Interactive Components
First, you’ll learn how to create components that users can interact with. For that, you’ll include a new <div> element above your charts. It’ll include two dropdowns and a date range selector that the user can use to filter the data and update the graphs.
You start by changing how you process your data. You no longer filter the data when you read them. Instead you find the regions and avocado types that are present in your data:
app.py
# ...

data = (
    pd.read_csv("avocado.csv")
    # Remove .query(...)
    .assign(Date=lambda data: pd.to_datetime(data["Date"], format="%Y-%m-%d"))
    .sort_values(by="Date")
)
regions = data["region"].sort_values().unique()
avocado_types = data["type"].sort_values().unique()

# ...
Next, you’ll use regions and avocado_types to populate a few dropdowns. Here’s how that looks in app.py:
app.py
 1# ...
 2
 3app.layout = html.Div(
 4    children=[
 5
 6        # ...
 7
 8        html.Div(
 9            children=[
10                html.Div(
11                    children=[
12                        html.Div(children="Region", className="menu-title"),
13                        dcc.Dropdown(
14                            id="region-filter",
15                            options=[
16                                {"label": region, "value": region}
17                                for region in regions
18                            ],
19                            value="Albany",
20                            clearable=False,
21                            className="dropdown",
22                        ),
23                    ]
24                ),
25                html.Div(
26                    children=[
27                        html.Div(children="Type", className="menu-title"),
28                        dcc.Dropdown(
29                            id="type-filter",
30                            options=[
31                                {
32                                    "label": avocado_type.title(),
33                                    "value": avocado_type,
34                                }
35                                for avocado_type in avocado_types
36                            ],
37                            value="organic",
38                            clearable=False,
39                            searchable=False,
40                            className="dropdown",
41                        ),
42                    ],
43                ),
44                html.Div(
45                    children=[
46                        html.Div(
47                            children="Date Range", className="menu-title"
48                        ),
49                        dcc.DatePickerRange(
50                            id="date-range",
51                            min_date_allowed=data["Date"].min().date(),
52                            max_date_allowed=data["Date"].max().date(),
53                            start_date=data["Date"].min().date(),
54                            end_date=data["Date"].max().date(),
55                        ),
56                    ]
57                ),
58            ],
59            className="menu",
60        ),
61
62        # ...
On lines 8 to 60, you define a <div> element above your graphs, consisting of two dropdowns and a date range selector. It’ll serve as a menu that the user will use to interact with the data:
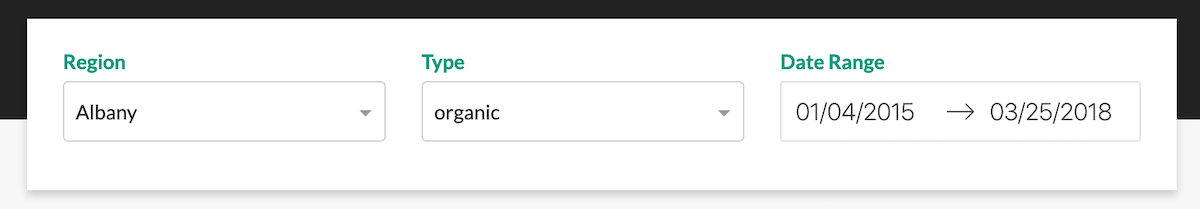
The first component in the menu is the Region dropdown. Focus on the code for that component:
html.Div(
    children=[
        html.Div(children="Region", className="menu-title"),
        dcc.Dropdown(
            id="region-filter",
            options=[
                {"label": region, "value": region}
                for region in regions
            ],
            value="Albany",
            clearable=False,
            className="dropdown",
        ),
    ]
),
Here, you define the dropdown that users will use to filter the data by region. In addition to the title, it has a dcc.Dropdown component. Here’s what each of the parameters means:
idis the identifier of this element.optionsindicates the options shown when the dropdown is selected. It expects a dictionary with labels and values.valueis the default value when the page loads.clearableallows the user to leave this field empty if set toTrue.classNameis a CSS class selector used for applying styles.
The Type and Date Range selectors follow the same structure as the Region dropdown. Feel free to review them on your own.
Next, take a look at the dcc.Graphs components:
app.py
# ...

app.layout = html.Div(
    children=[

        # ...

        html.Div(
            children=[
                html.Div(
                    children=dcc.Graph(
                        id="price-chart",
                        config={"displayModeBar": False},
                    ),
                    className="card",
                ),
                html.Div(
                    children=dcc.Graph(
                        id="volume-chart",
                        config={"displayModeBar": False},
                    ),
                    className="card",
                ),
            ],
            className="wrapper",
        ),
    ]
)

# ...
In this part of the code, you define the dcc.Graph components. You may have noticed that, compared to the previous version of the dashboard, the components are missing the figure argument. That’s because a callback function will now generate the figure argument using the inputs that the user sets using the Region, Type, and Date Range selectors.
How to Define Callbacks
You’ve defined how the user will interact with your application. Now you need to make your application react to user interactions. For that, you’ll use callback functions.
Dash’s callback functions are regular Python functions with an app.callback decorator. In Dash, when an input changes, a callback function is triggered. The function performs some predetermined operations, like filtering a dataset, and returns an output to the application. In essence, callbacks link inputs and outputs in your app.
Here’s the callback function that’s used for updating the graphs:
app.py
 1# ..
 2
 3@app.callback(
 4    Output("price-chart", "figure"),
 5    Output("volume-chart", "figure"),
 6    Input("region-filter", "value"),
 7    Input("type-filter", "value"),
 8    Input("date-range", "start_date"),
 9    Input("date-range", "end_date"),
10)
11def update_charts(region, avocado_type, start_date, end_date):
12    filtered_data = data.query(
13        "region == @region and type == @avocado_type"
14        " and Date >= @start_date and Date <= @end_date"
15    )
16    price_chart_figure = {
17        "data": [
18            {
19                "x": filtered_data["Date"],
20                "y": filtered_data["AveragePrice"],
21                "type": "lines",
22                "hovertemplate": "$%{y:.2f}<extra></extra>",
23            },
24        ],
25        "layout": {
26            "title": {
27                "text": "Average Price of Avocados",
28                "x": 0.05,
29                "xanchor": "left",
30            },
31            "xaxis": {"fixedrange": True},
32            "yaxis": {"tickprefix": "$", "fixedrange": True},
33            "colorway": ["#17B897"],
34        },
35    }
36
37    volume_chart_figure = {
38        "data": [
39            {
40                "x": filtered_data["Date"],
41                "y": filtered_data["Total Volume"],
42                "type": "lines",
43            },
44        ],
45        "layout": {
46            "title": {"text": "Avocados Sold", "x": 0.05, "xanchor": "left"},
47            "xaxis": {"fixedrange": True},
48            "yaxis": {"fixedrange": True},
49            "colorway": ["#E12D39"],
50        },
51    }
52    return price_chart_figure, volume_chart_figure
53
54# ...
On lines 4 to 9, you define the inputs and outputs inside the app.callback decorator.
First, you define the outputs using Output objects. They take two arguments:
- The identifier of the element that they’ll modify when the function executes
- The property of the element to be modified
For example, Output("price-chart", "figure") will update the figure property of the "price-chart" element.
Then you define the inputs using Input objects. They also take two arguments:
- The identifier of the element that they’ll be watching for changes
- The property of the watched element that they’ll be watching for changes
So, Input("region-filter", "value") will watch the "region-filter" element and its value property for changes. The argument passed on to the callback function will be the new value of region-filter.value.
Note: The Input object that you’re using here is imported directly from dash. Be careful not to confuse it with the Input component coming from dcc. These objects aren’t interchangeable, and they have different purposes.
On line 11, you define the function that’ll be applied when an input changes. It’s worth noticing that the arguments of the function will correspond with the order of the Input objects supplied to the callback. There’s no explicit relationship between the names of the arguments in the function and the values specified in the Input objects.
Finally, on lines 12 to 52, you define the body of the function. In this case, the function takes the inputs (region, type of avocado, and date range), filters the data, and generates the figure objects for the price and volume charts.
That’s all! If you’ve followed along to this point, then your dashboard should look like this:
Way to go! That’s the final version of your dashboard. In addition to making it look beautiful, you also made it interactive. The only missing step is making it public so you can share it with others.
Deploy Your Dash Application to PythonAnywhere
You’re done building your application, and you have a beautiful, fully interactive dashboard. Now you’ll learn how to deploy it.
Dash apps are Flask apps, so both share the same deployment options. In this section, you’ll deploy your app on PythonAnywhere, which offers a free tier for hosting Python web applications in the cloud.
How to Create a Free PythonAnywhere Account
Before you get started, make sure you’ve signed up for a PythonAnywhere beginner account, which is completely free of charge and doesn’t require you to provide any payment details. That said, it comes with a few limitations that you should be aware of. The most important ones will prevent you from doing the following:
- Running more than one web application at a time
- Defining a custom domain name
- Exceeding the available disk quota (512 MB)
- Using the CPU for longer than 100 seconds per day
- Making unrestricted HTTP requests from your app
For this tutorial, though, you won’t need any of that!
If you’re based in Europe, then consider signing up through eu.pythonanywhere.com instead of the www.pythonanywhere.com. It’ll ensure GDPR compliance for your data, which PythonAnywhere will store on servers in Germany. Because of that, you may also experience slightly faster response times. Finally, if you decide to become a paid customer one day, then you’ll be charged in euros instead of US dollars.
Feel free to follow either of the two PythonAnywhere links above if you don’t care about any of these features at the moment. Note, however, that once you register a username on one domain, then you won’t be able to reuse it on the other!
Another reason to think carefully about your username is that it must be unique, as it’ll become a part of your very own domain name, such as in these examples:
http://realpython.pythonanywhere.com/
http://realpython.eu.pythonanywhere.com/
Once you register a new account on PythonAnywhere, you must confirm your email address so that you can reset the password if you forget it. Also, it might be a good idea to enable two-factor authentication on the Security tab in your Account settings as an extra security measure.
If you’ve just created a new account, then you’re already good to go. But if you registered a PythonAnywhere account a while ago, then you might need to change your system image to a newer one, which comes with a more recent Python version and newer third-party libraries. At the time of writing, the latest image, called haggis, shipped with Python 3.10.5, pandas 1.3.5, and Dash 2.4.1.
Note: You can always check the available batteries for a given image and Python version.
With that out of the way, it’s time to create your first web app on PythonAnywhere!
How to Deploy Your Avocado Analytics App
Because Dash apps are Flask apps with some extra frills, you can take advantage of PythonAnywhere’s excellent support for this popular Python web framework.
When you’re logged in to your PythonAnywhere account, create a new Bash shell console, either from the Dashboard or the Consoles tab. This will throw you into an interactive prompt of the virtual server, letting you remotely execute commands straight from your web browser.
There are already several useful programs installed for you, including a Git client, which you’ll use to get your project’s source code into PythonAnywhere. You can also upload files in other ways, but using Git seems the most convenient. If you haven’t made your own repository yet, then you might clone Real Python’s materials repository with your sample Dash application in it:
$ git clone --depth=1 https://github.com/realpython/materials.git
The --depth=1 option tells Git only to clone the latest commit, which saves time and disk space. Note that if you don’t want to configure SSH keys for your PythonAnywhere machine, then you’ll have to clone a public repository using the HTTPS protocol. Since August 2021, cloning private repositories has been possible only after configuring a personal access token in GitHub.
When the repository is cloned, you can move and rename a subfolder with the finished avocado app to your home folder on PythonAnywhere, and then remove the rest of the materials:
$ mv materials/python-dash/avocado_analytics_3/ ~/avocado_analytics
$ rm -rf materials/
Remember that you only have 512 megabytes of disk space on the free tier at your disposal, and the materials take up a significant portion of that!
At this point, your home folder should look like this:
home/realpython/
│
└── avocado_analytics/
    │
    ├── assets/
    │   ├── favicon.ico
    │   └── style.css
    │
    ├── app.py
    └── avocado.csv
Of course, the username realpython will be different on your account, but the overall folder structure should remain the same.
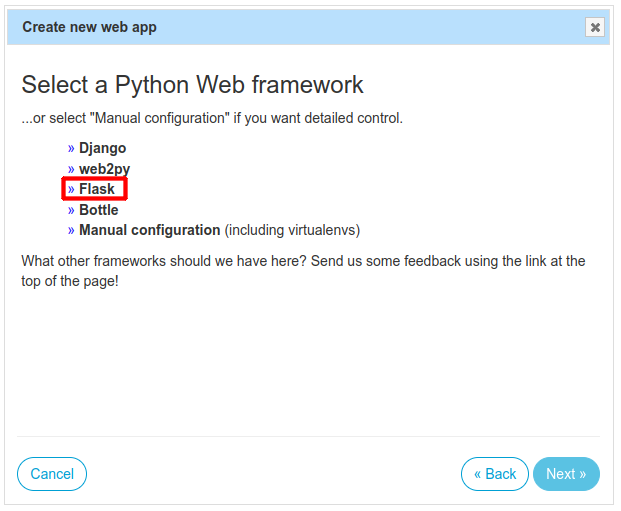
Now, go the Web tab and click the button labeled Add a new web app. This will open a wizard, asking you a few questions. First, select Flask as the Python web framework of your choice:
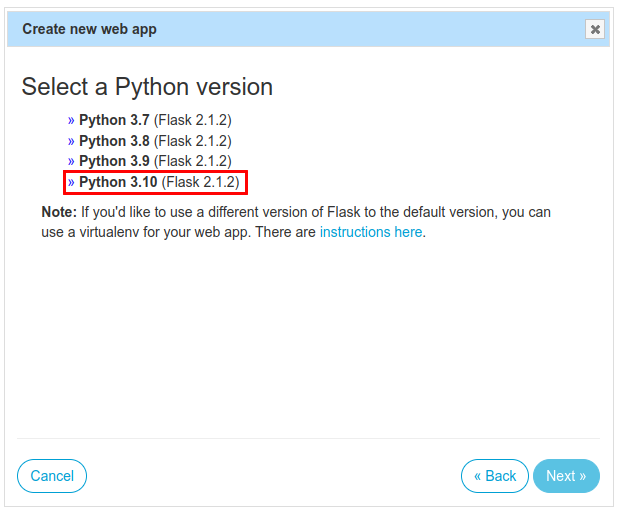
Next, you’ll see a specific Flask version running on top of the given Python interpreter. Select the latest version available:
In the next step, you’ll need to update the file path leading up to the main Python module with your Flask app:
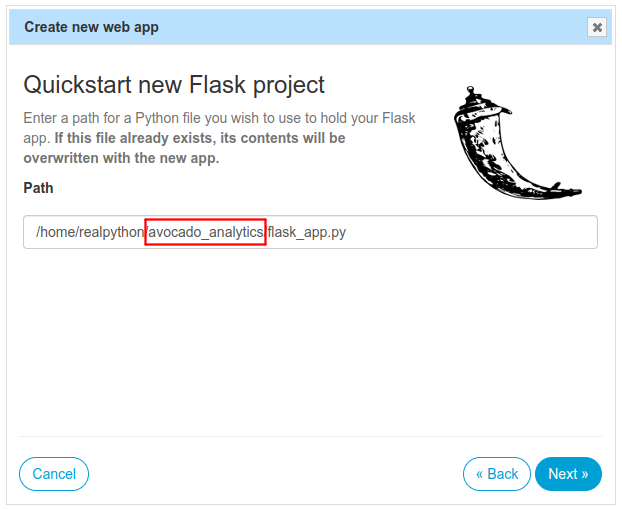
While you can change it later, it’s much easier if you do it right now, so make sure to rename the default mysite/ folder with avocado_analytics/ to match your project’s name. At the same time, you want to keep the suggested flask_app.py filename intact. PythonAnywhere will generate this file and populate it with a demo app, so if you renamed it to app.py, then the code that you cloned from GitHub would get overwritten!
Once this is done, you’ll be presented with a number of configuration options for your new web app. First, you need to update the working directory of the app to be the same as the source code:
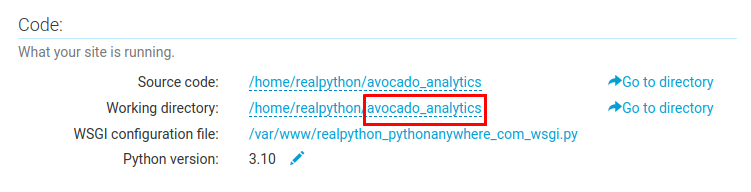
This will ensure that Python can find your avocado.csv file at runtime and open it for reading.
Next, you’ll need to tweak the default WSGI server configuration, which is slightly different for Dash apps than it is for Flask. PythonAnywhere uses the uWSGI server behind the scenes, which reads the configuration from a special Python module located in the /var/www/ folder.
Click the WSGI configuration file option visible in the screenshot above to open it in an editor in your web browser:
 # This file contains the WSGI configuration required to serve up your
 # web application at http://<your-username>.pythonanywhere.com/
 # It works by setting the variable 'application' to a WSGI handler of some
 # description.
 #
 # The below has been auto-generated for your Flask project

 import sys

 # add your project directory to the sys.path
 project_home = '/home/realpython/avocado_analytics'
 if project_home not in sys.path:
     sys.path = [project_home] + sys.path

 # import flask app but need to call it "application" for WSGI to work
-from flask_app import app as application  # noqa
+from app import app
+application = app.server
You need to rename the flask_app module generated by the wizard to the actual app module that came with your avocado project. Besides that, you must expose the callable WSGI application through the Dash app’s .server field, as described in the official help page on PythonAnywhere. You might as well double-check if the path in your project_home variable is correct.
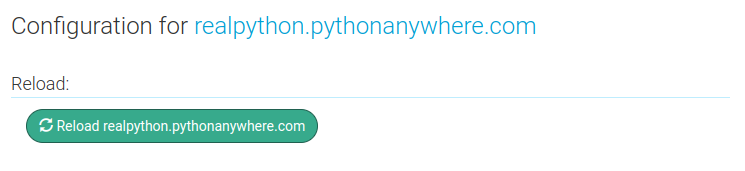
Finally, save the file by hitting Ctrl+S, go back to the Web tab, and click the green button to reload your web app:
When you visit the corresponding URL of your web app deployed to PythonAnywhere, you should see the familiar interface:
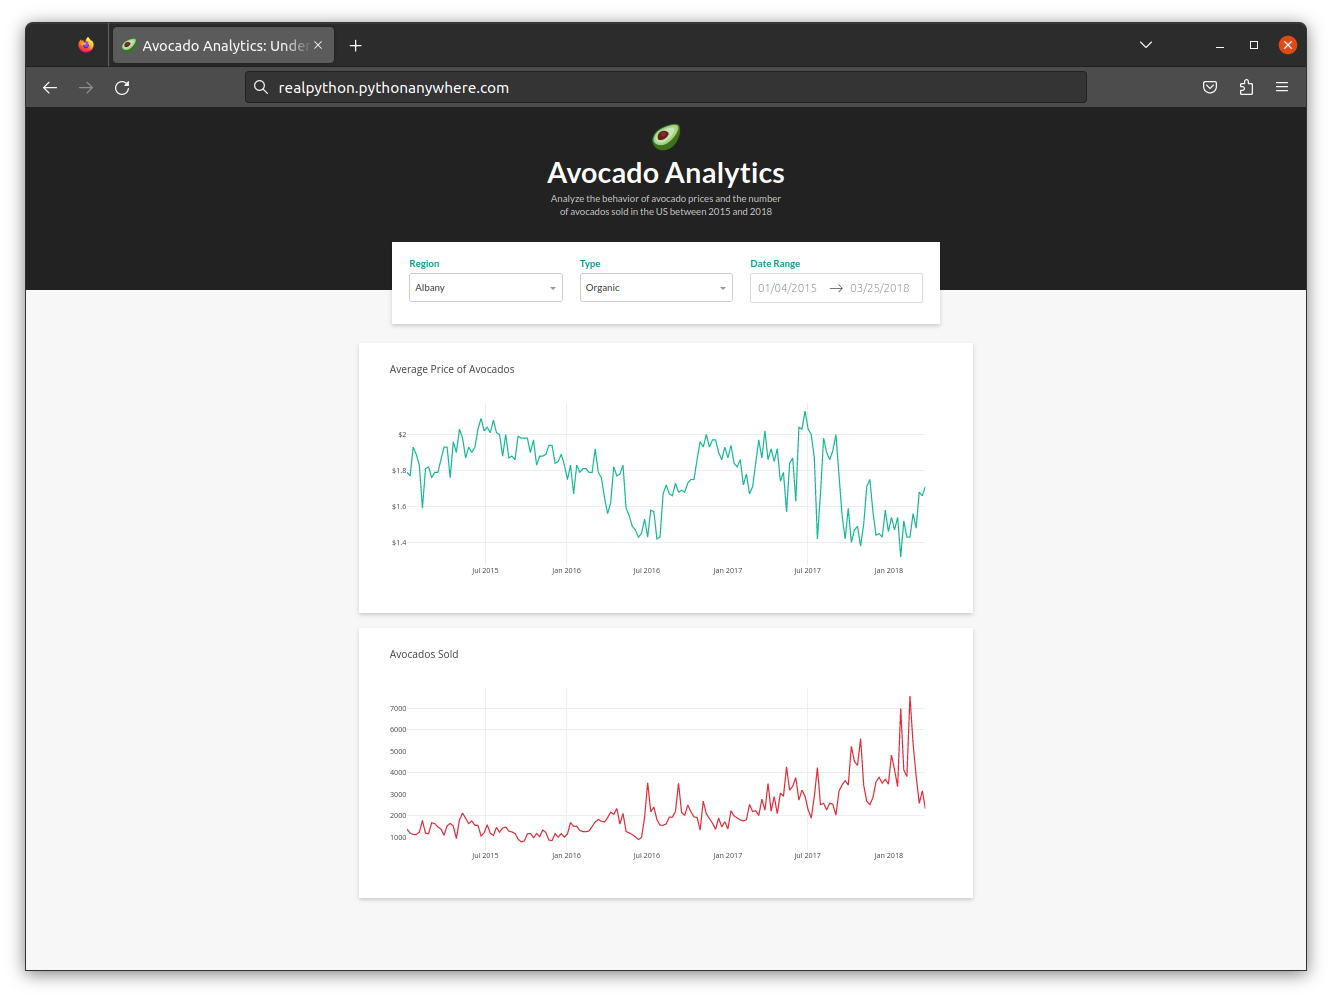
That’s it! Note that you never installed Dash or pandas because they were already shipped with PythonAnywhere. Also, you didn’t have to configure static resources, which are typically served by the web server rather than Flask, because Dash takes care of them automatically.
Note: If you need more control over the external library versions, then you can use virtualenvwrapper to create a virtual environment for the platform and manually install those dependencies. Unfortunately, doing so will likely consume all of your disk space and drain your CPU bandwidth to the point you’ll end up in the tarpit.
You can now share your Dash apps with the world by deploying them to PythonAnywhere or other web hosting providers.
Conclusion
Congratulations! You just built, customized, and deployed your first dashboard using Dash. You went from a bare-bones dashboard to a fully interactive one deployed on PythonAnywhere.
With this knowledge, you can use Dash to build analytical applications to share with others. As more companies put more weight on the use of data, knowing how to use Dash will increase your impact in the workplace. What used to be a task only experts could perform, you can now do in an afternoon.
In this tutorial, you’ve learned:
- How to create a dashboard using Dash
- How to customize the styling of your Dash application
- How to make your app interactive by using Dash components
- What callbacks are and how you can use them to create interactive applications
- How to deploy your application on PythonAnywhere
Now you’re ready to develop new Dash applications. Find a dataset, think of some exciting visualizations, and build another dashboard!
You can download the source code, data, and resources for the sample applications that you made in this tutorial by clicking the link below:
Get the Source Code: Click here to get the source code you’ll use to learn about creating data visualization interfaces in Python with Dash in this tutorial.
Frequently Asked Questions
Now that you have some experience with Dash in Python, you can use the questions and answers below to check your understanding and recap what you’ve learned.
These FAQs are related to the most important concepts you’ve covered in this tutorial. Click the Show/Hide toggle beside each question to reveal the answer.
Dash is an open-source framework for building data visualization interfaces. It allows you to create interactive web applications using Python without needing advanced web development skills.
You can use Dash to create dashboards for data analysis, visualize large datasets, and build interactive tools for real-time data updates, such as monitoring sales or tracking sensor data.
You can customize the style of a Dash app using CSS. You can apply styles directly to components with the style argument or by linking an external CSS file and using class names to style multiple components consistently.
You can conveniently deploy your Dash application on PythonAnywhere, which offers a free tier for hosting Python web applications.
Take the Quiz: Test your knowledge with our interactive “Develop Data Visualization Interfaces in Python With Dash” quiz. You’ll receive a score upon completion to help you track your learning progress:
Interactive Quiz
Develop Data Visualization Interfaces in Python With DashTest your understanding of building interactive Python dashboards with Dash, including layout, styling, callbacks, and deployment.