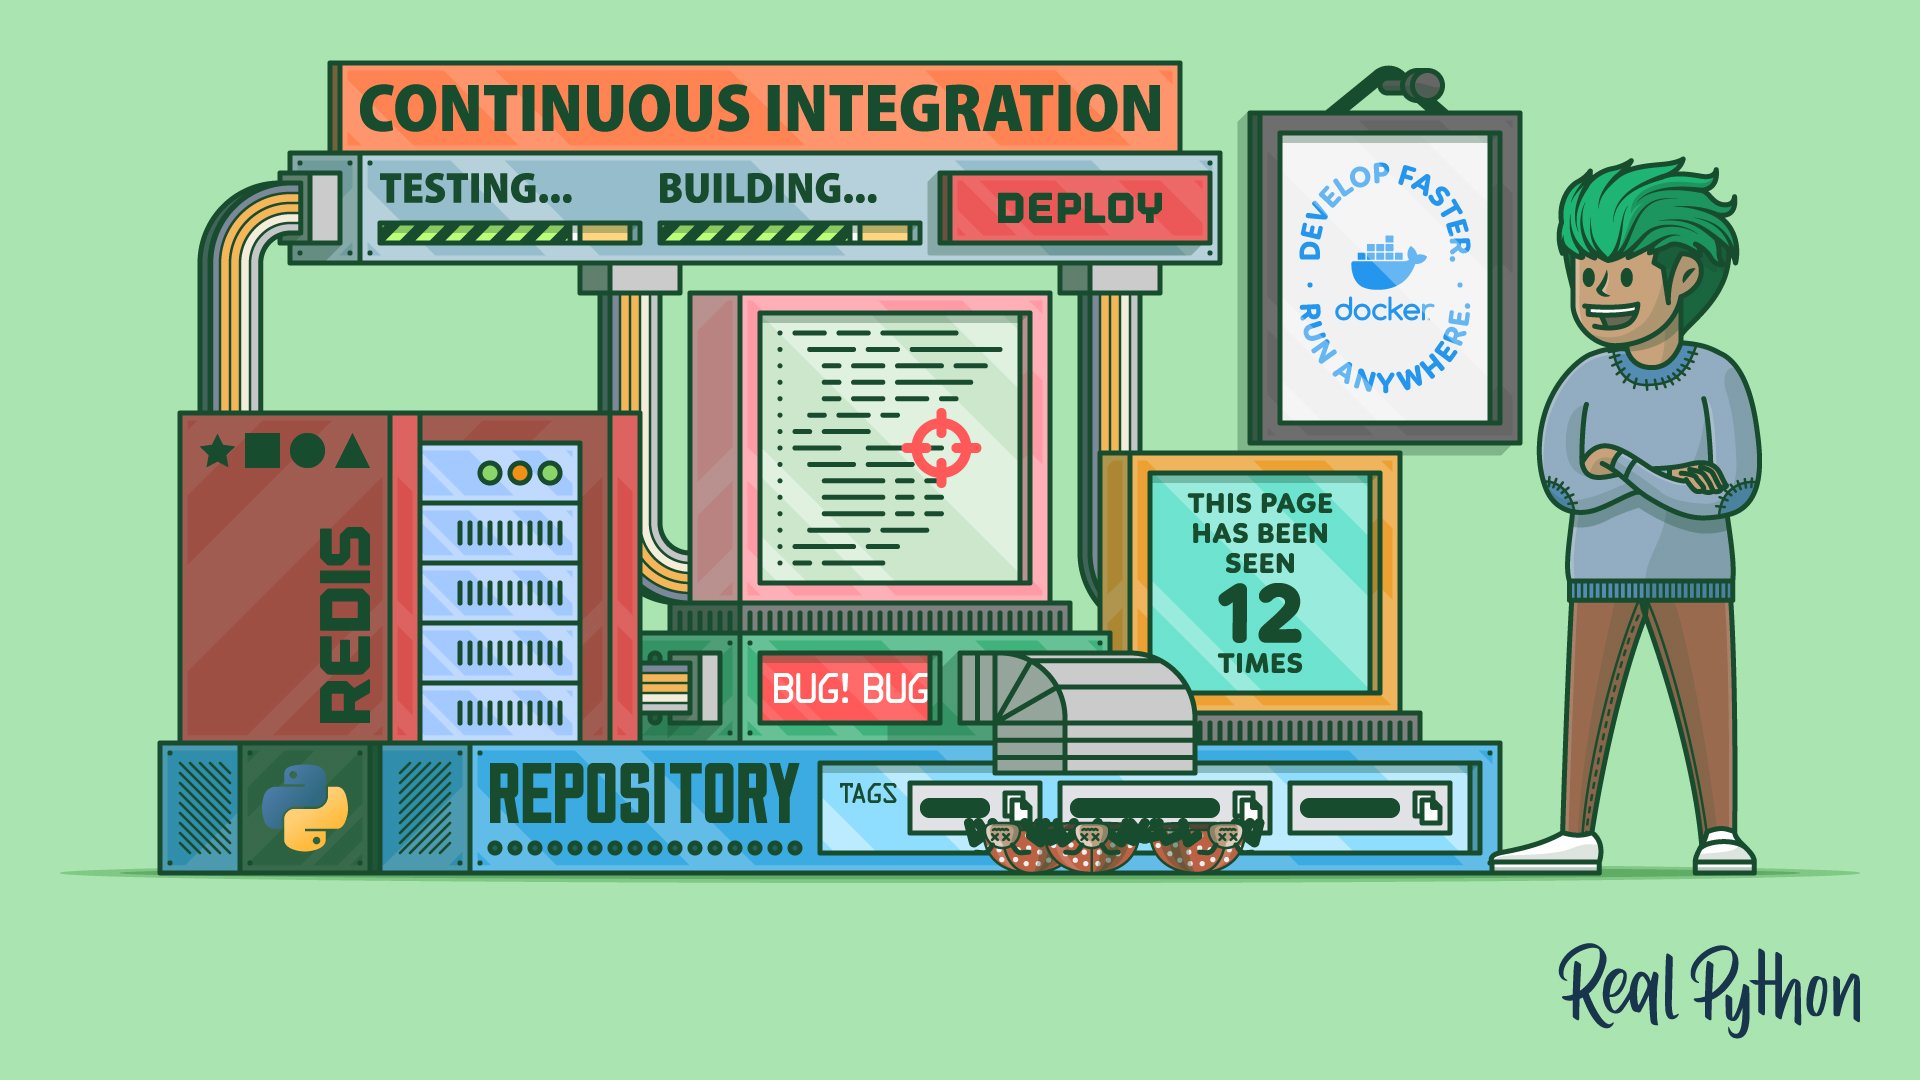
Continuous integration (CI) has become essential to software development, allowing teams to merge code changes frequently and catch errors early. Docker containers help facilitate the continuous integration process by providing a consistent environment where you can test and ship code on each commit.
In this tutorial, you’ll learn how to use Docker to create a robust continuous integration pipeline for a Flask web application. You’ll go through the steps of developing and testing the application locally, containerizing it, orchestrating containers using Docker Compose, and defining a CI pipeline using GitHub Actions. By the end of this tutorial, you’ll be able to create a fully automated CI pipeline for your web applications.
In this tutorial, you’ll:
- Run a Redis server locally in a Docker container
- Dockerize a Python web application written in Flask
- Build Docker images and push them to the Docker Hub registry
- Orchestrate multi-container applications with Docker Compose
- Replicate a production-like infrastructure anywhere
- Define a continuous integration workflow using GitHub Actions
Ideally, you should have some experience with web development in Python, test automation, the use of Redis with Python, and source code version control with Git and GitHub. Previous exposure to Docker would be a plus but isn’t necessary. You should also have a Git client and a GitHub account to follow along and replicate the steps of this tutorial.
Note: This tutorial is loosely based on an older tutorial entitled Docker in Action - Fitter, Happier, More Productive, which was written by Michael Herman, who presented his CI workflow at PyTennessee on February 8, 2015. You can view the corresponding slides presented at the conference if you’re interested.
Unfortunately, many of the tools described in the original tutorial are no longer supported or available for free. In this updated tutorial, you’ll use the latest tools and technologies, such as GitHub Actions.
If you’d like to skip the initial steps of setting up Docker on your computer and building a sample web application, then jump straight to defining a continuous integration pipeline. Either way, you’ll want to download the supporting materials, which come with a finished Flask web application and the related resources that will help you follow along with this tutorial:
Free Download: Click here to download your Flask application and related resources so you can define a continuous integration pipeline with Docker.
Get an Overview of the Project Architecture
By the end of this tutorial, you’ll have a Flask web application for tracking page views stored persistently in a Redis data store. It’ll be a multi-container application orchestrated by Docker Compose that you’ll be able to build and test locally as well as in the cloud, paving the way for continuous integration:
The application consists of two Docker containers. The first container will run a Flask application on top of Gunicorn, responding to HTTP requests and updating the number of page views. The second container will run a Redis instance for storing page view data persistently in a local volume on the host machine.
Docker is all that’s required to run this application, and you’ll set it up now.
Set Up Docker on Your Computer
Docker is an umbrella term that can have a few different meanings for different people depending on the context. For example, when someone refers to docker, they can mean one of the following:
- Docker, Inc.: The company behind the platform and the related tools
- Docker: The open-source container platform
- Docker CLI: The
dockerclient command-line program dockerd: The Docker daemon that manages the containers
There are also several tools and projects associated with the Docker platform, such as:
- Docker Compose
- Docker Desktop
- Docker Engine
- Docker Hub
- Docker Swarm Mode
In this tutorial, you’ll use all but the last one from the list above. By the way, don’t confuse the legacy Docker Classic Swarm, which was an external tool, with the Docker Swarm Mode built into the Docker Engine since version 1.12.
Note: You may have heard of Docker Machine and Docker Toolbox. These are old tools that are no longer maintained.
The main problem that Docker solves is the ability to run applications anywhere in consistent and reproducible environments with little or no configuration. It can package your application code, binaries, and dependencies, such as language runtimes and libraries, into a single artifact. You’ll use Docker to simulate a hypothetical production environment on your local machine during development and on a continuous integration server.
You have two choices for installing Docker:
If you’re comfortable around the terminal and appreciate an extra level of control, then look no further than the open-source Docker Engine, which provides the core runtime and the command-line interface for managing your containers. On the other hand, if you prefer a one-stop-shop solution with an intuitive graphical user interface, then you should consider Docker Desktop instead.
Note: Out of the box, the desktop application comes with Docker Compose, which you’ll need later on, when you’re orchestrating containers for continuous integration.
When you browse the official Docker documentation, you may get the impression that Docker Desktop takes the spotlight. It’s a truly fantastic tool, but you must remember that Docker Desktop remains free of charge for personal use only. Since August 2021, you’ve needed a paid subscription to use it in commercial projects.
While it’s technically possible to have both tools installed side by side, you should generally avoid using them at the same time to minimize the risk of any potential interference between their virtual networks or port bindings. You can do so by stopping one of them and switching the context between Docker Engine and Docker Desktop.
Note: Docker Desktop used to be available only on Windows and macOS, but that’s changed, and you can now install it on certain Linux distributions, too, including Ubuntu, Debian, and Fedora. However, the Linux version of Docker Desktop runs on top of a virtual machine to mimic the user experience of working with it on other operating systems.
To verify that you’ve successfully installed Docker on your system, either as Docker Engine or the Docker Desktop wrapper application, open the terminal and type the following command:
$ docker --version
Docker version 23.0.4, build f480fb1
You should see your Docker version along with the build number. If you’re on Linux, then you might want to follow the post-installation steps to use the docker command without prefacing it with sudo for administrative privileges.
Before you can start using Docker to help with continuous integration, you’ll need to create a rudimentary web application.
Develop a Page View Tracker in Flask
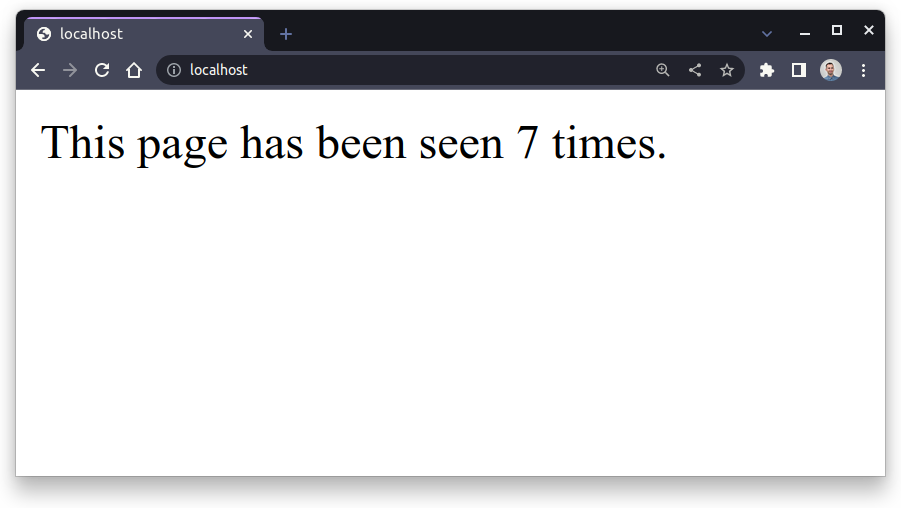
Over the next few sections, you’ll be implementing a bare-bones web application using the Flask framework. Your application will keep track of the total number of page views and display that number to the user with each request:
The current state of the application will be saved in a Redis data store, which is commonly used for caching and other types of data persistence. This way, stopping your web server won’t reset the view count. You can think of Redis as a kind of database.
If you’re not interested in building this application from scratch, then feel free to download its complete source code by clicking the link below, and jump ahead to dockerizing your Flask web application:
Free Download: Click here to download your Flask application and related resources so you can define a continuous integration pipeline with Docker.
Even if you intend to write the code yourself, it’s still a good idea to download the finished project and use it as a reference to compare with your implementation in case you get stuck.
Before you can start developing the application, you’ll need to set up your working environment.
Prepare the Environment
As with every Python project, you should follow roughly the same steps when you start, which include making a new directory and then creating and activating an isolated virtual environment for your project. You can do so directly from your favorite code editor like Visual Studio Code or a full-fledged IDE such as PyCharm, or you can type a few commands in the terminal:
First, make a new directory named page-tracker/ and then create a Python virtual environment called venv/ right inside of it. Give the virtual environment a descriptive prompt to make it easily recognizable. Finally, after activating the newly created virtual environment, upgrade pip to the latest version in order to avoid potential issues when installing Python packages in the future.
Note: On Windows, you may need to run Windows Terminal as administrator first and loosen your script execution policy before creating the virtual environment.
In this tutorial, you’ll use the modern way of specifying your project’s dependencies and metadata through a pyproject.toml configuration file and setuptools as the build back end. Additionally, you’ll follow the src layout by placing your application’s source code in a separate src/ subdirectory to better organize the files in your project. This will make it straightforward to package your code without the automated tests that you’ll add later.
Go ahead and scaffold your Python project placeholder using the following commands:
When you’re done, you should have the following directory structure in place:
page-tracker/
│
├── src/
│   └── page_tracker/
│       ├── __init__.py
│       └── app.py
│
├── venv/
│
├── constraints.txt
└── pyproject.toml
As you can see, you’ll have only one Python module, app, defined in a package called page_tracker, sitting inside the src/ directory. The constraints.txt file will specify pinned versions of your project’s dependencies in order to achieve repeatable installs.
This project will depend on two external libraries, Flask and Redis, which you can declare in your pyproject.toml file:
# pyproject.toml

[build-system]
requires = ["setuptools>=67.0.0", "wheel"]
build-backend = "setuptools.build_meta"

[project]
name = "page-tracker"
version = "1.0.0"
dependencies = [
    "Flask",
    "redis",
]
Note that you don’t typically specify dependency versions here. Instead, you can freeze them along with any transitive dependencies in a requirements or constraints file. The first one tells pip what packages to install, and the latter enforces specific package versions of the transitive dependencies, resembling a Pipenv or Poetry lock file.
To generate a constraints file, you must first install your page-tracker project into the active virtual environment, which will bring the required external libraries from the Python Package Index (PyPI). Make sure that you’ve created the desired folder structure, and then issue the following commands:
(page-tracker) $ python -m pip install --editable .
(page-tracker) $ python -m pip freeze --exclude-editable > constraints.txt
Even though you haven’t typed a single line of code yet, Python will recognize and install your package placeholder. Because your package follows the src layout, it’s convenient to install it in editable mode during development. This will allow you to make changes to your source code and have them reflected in the virtual environment immediately without a reinstall. However, you want to exclude the editable package from the constraints file.
Note: The generated constraints file is super valuable if you’re planning to share your project. It means someone else can run the following command in their terminal to reproduce the same environment as yours:
(page-tracker) $ python -m pip install -c constraints.txt .
Because you provided a constraints file through the -c option, pip installed the pinned dependencies instead of the latest ones available. That means you have repeatable installs. You’ll use a similar command later to build a Docker image.
Okay. You’re almost ready to start coding your Flask web application. Before doing so, you’ll switch gears for a moment and prepare a local Redis server to connect to over a network.
Run a Redis Server Through Docker
The name Redis is a portmanteau of the words remote dictionary server, which pretty accurately conveys its purpose as a remote, in-memory data structure store. Being a key-value store, Redis is like a remote Python dictionary that you can connect to from anywhere. It’s also considered one of the most popular NoSQL databases used in many different contexts. Frequently, it serves the purpose of a cache on top of a relational database.
Note: While Redis keeps all of its data in volatile memory, which makes it extremely fast, the server comes with a variety of persistence options. They can ensure different levels of data durability in case of a power outage or reboot. However, configuring Redis correctly often proves difficult, which is why many teams decide to use a managed service outsourced to cloud providers.
Installing Redis on your computer is quite straightforward, but running it through Docker is even simpler and more elegant, assuming that you’ve installed and configured Docker before. When you run a service, such as Redis, in a Docker container, it remains isolated from the rest of your system without causing clutter or hogging system resources like network port numbers, which are limited.
To run Redis without installing it on your host machine, you can run a new Docker container from the official Redis image by invoking the following command:
$ docker run -d --name redis-server redis
Unable to find image 'redis:latest' locally
latest: Pulling from library/redis
26c5c85e47da: Pull complete
39f79586dcf2: Pull complete
79c71d0520e5: Pull complete
60e988668ca1: Pull complete
873c3fc9fdc6: Pull complete
50ce7f9bf183: Pull complete
Digest: sha256:f50031a49f41e493087fb95f96fdb3523bb25dcf6a3f0b07c588ad3cdb...
Status: Downloaded newer image for redis:latest
09b9842463c78a2e9135add810aba6c4573fb9e2155652a15310009632c40ea8
This creates a new Docker container based on the latest version of the redis image, with the custom name redis-server, which you’ll refer to later. The container is running in the background in detached mode (-d). When you run this command for the first time, Docker will pull the corresponding Docker image from Docker Hub, which is the official repository of Docker images, akin to PyPI.
As long as everything goes according to plan, your Redis server should be up and running. Because you started the container in detached mode (-d), it’ll remain active in the background. To verify that, you can list your Docker containers using the docker container ls command or the equivalent docker ps alias:
$ docker ps
CONTAINER ID   IMAGE   ...   STATUS              PORTS      NAMES
09b9842463c7   redis   ...   Up About a minute   6379/tcp   redis-server
Here, you can see that a container with an ID prefix matching the one you got when running the docker run command has been up since about a minute ago. The container is based on the redis image, has been named redis-server, and uses TCP port number 6379, which is the default port for Redis.
Next, you’ll try connecting to that Redis server in various ways.
Test the Connection to Redis
On the overview page of the official Redis image on Docker Hub, you’ll find instructions on how to connect to a Redis server running in a Docker container. Specifically, this page talks about using the dedicated interactive command-line interface, Redis CLI, that comes with your Docker image.
You can start another Docker container from the same redis image, but this time, set the container’s entry point to the redis-cli command instead of the default Redis server binary. When you set up multiple containers to work together, you should use Docker networks, which require a few extra steps to configure.
First, create a new user-defined bridge network named after your project, for example:
$ docker network create page-tracker-network
c942131265bf097da294edbd2ac375cd5410d6f0d87e250041827c68a3197684
By defining a virtual network such as this, you can hook up as many Docker containers as you like and let them discover each other through descriptive names. You can list the networks that you’ve created by running the following command:
$ docker network ls
NETWORK ID     NAME                   DRIVER    SCOPE
1bf8d998500e   bridge                 bridge    local
d5cffd6ea76f   host                   host      local
a85d88fc3abe   none                   null      local
c942131265bf   page-tracker-network   bridge    local
Next, connect your existing redis-server container to this new virtual network, and specify the same network for the Redis CLI when you start its corresponding container:
$ docker network connect page-tracker-network redis-server
$ docker run --rm -it \
             --name redis-client \
             --network page-tracker-network \
             redis redis-cli -h redis-server
The --rm flag tells Docker to remove the created container as soon as you terminate it since this is a temporary or ephemeral container that you don’t need to start ever again. The -i and -t flags, abbreviated to -it, run the container interactively, letting you type commands by hooking up to your terminal’s standard streams. With the --name option, you give your new container a descriptive name.
The --network option connects your new redis-client container to the previously created virtual network, allowing it to communicate with the redis-server container. This way, both containers will receive hostnames corresponding to their names given by the --name option. Notice that, by using the -h parameter, you tell Redis CLI to connect to a Redis server identified by its container name.
Note: There’s an even quicker way to connect your two containers through a virtual network without explicitly creating one. You can specify the --link option when running a new container:
$ docker run --rm -it \
             --name redis-client \
             --link redis-server:redis-client \
             redis redis-cli -h redis-server
However, this option is deprecated and may be removed from Docker at some point.
When your new Docker container starts, you’ll drop into an interactive Redis CLI, which resembles a Python REPL with the following prompt:
redis-server:6379> SET pi 3.14
OK
redis-server:6379> GET pi
"3.14"
redis-server:6379> DEL pi
(integer) 1
redis-server:6379> KEYS *
(empty array)
Once there, you can test a few Redis commands by, for example, setting a key-value pair, getting the value of the corresponding key, deleting that key-value pair, or retrieving the list of all keys currently stored in the server. To exit the interactive Redis CLI, press Ctrl+C on your keyboard.
If you installed Docker Desktop, then, in most cases, it won’t route traffic from your host machine to the containers. There’ll be no connection between your local network and the default Docker network:
Docker Desktop for Mac can’t route traffic to containers. (Source)
Docker Desktop for Windows can’t route traffic to Linux containers. However, you can ping the Windows containers. (Source)
The same is true for Docker Desktop on Linux. On the other hand, if you’re using Docker Engine or running Windows containers on a Windows host machine, then you’ll be able to access such containers by their IP addresses.
Therefore, it may sometimes be possible for you to communicate with the Redis server directly from your host machine. First, find out the IP address of the corresponding Docker container:
$ docker inspect redis-server \
  -f '{{range .NetworkSettings.Networks}}{{.IPAddress}}{{println}}{{end}}'
172.17.0.2
172.18.0.2
If you see more than one IP address, then it means that your container is connected to multiple networks. Containers get automatically connected to the default Docker network when you start them.
Take note of one of these addresses, which may be different for you. Now, you can use this IP address for the -h parameter’s value instead of the linked container name in redis-cli. You can also use this IP address to connect to Redis with netcat or a Telnet client, like PuTTY or the telnet command:
$ telnet 172.17.0.2 6379
Trying 172.17.0.2...
Connected to 172.17.0.2.
Escape character is '^]'.
SET pi 3.14
+OK
GET pi
$4
3.14
DEL pi
:1
KEYS *
*0
^]
telnet> Connection closed.
Remember to provide the port number, which defaults to 6379, on which Redis listens for incoming connections. You can type Redis commands in plaintext here because the server uses an unencrypted protocol unless you explicitly enable TLS support in the configuration.
Finally, you can take advantage of port mapping to make Redis available outside of the Docker container. During development, you’ll want to connect to Redis directly rather than through a virtual network from another container, so you don’t have to connect it to any network just yet.
To use port mapping, stop and remove your existing redis-server, and then run a new container with the -p option defined as below:
$ docker stop redis-server
$ docker rm redis-server
$ docker run -d --name redis-server -p 6379:6379 redis
The number on the left of the colon (:) represents the port number on the host machine or your computer, while the number on the right represents the mapped port inside the Docker container that’s about to run. Using the same port number on both sides effectively forwards it so that you can connect to Redis as if it were running locally on your computer:
$ telnet localhost 6379
Trying 127.0.0.1...
Connected to localhost.
Escape character is '^]'.
INCR page_views
:1
INCR page_views
:2
INCR page_views
:3
^]
telnet> Connection closed.
After connecting to Redis, which is now visible on localhost and the default port, you use the INCR command to increment the number of page views. If the underlying key doesn’t exist yet, then Redis will initialize it with a value of 1.
Note: If you have Redis installed locally, or some system process is also using port 6379 on your host machine, then you’ll need to map your port numbers differently using an unoccupied port. For example, you could do the following:
$ docker run -d --name redis-server -p 9736:6379 redis
This will allow you to connect to localhost on port 9736 if that’s not already taken by another service. It doesn’t matter what port you use as long as it’s available.
Now that you know how to connect to Redis from the command line, you can move on and see how to do the same from a Python program.
Connect to Redis From Python
At this point, you have a Redis server running in a Docker container, which you can access on localhost using the default port number for Redis. If you’d like to learn more about your container, or any other Docker resource, then you can always retrieve valuable information by inspecting the object at hand:
$ docker inspect redis-server
[
    {
        "Id": "09b9842463c78a2e9135add810aba6...2a15310009632c40ea8",
        ⋮
        "NetworkSettings": {
            ⋮
            "Ports": {
                "6379/tcp": null
            },
            ⋮
            "IPAddress": "172.17.0.2",
            ⋮
        }
    }
]
In this case, you’re asking for information about the redis-server container, which includes a plethora of details, such as the container’s network configuration. The docker inspect command returns data in the JSON format by default, which you can filter down further using Go templates.
Next, open the terminal, activate your project’s virtual environment, and start a new Python REPL:
Assuming you previously installed the redis package in this virtual environment, you should be able to import the Redis client for Python and call one of its methods:
>>> from redis import Redis
>>> redis = Redis()
>>> redis.incr("page_views")
4
>>> redis.incr("page_views")
5
When you create a new Redis instance without specifying any arguments, it’ll try to connect to a Redis server running on localhost and the default port, 6379. In this case, calling .incr() confirms that you’ve successfully established a connection with Redis sitting in your Docker container because it remembered the last value of the page_views key.
If you need to connect to Redis located on a remote machine, then supply a custom host and a port number as parameters:
>>> from redis import Redis
>>> redis = Redis(host="127.0.0.1", port=6379)
>>> redis.incr("page_views")
6
Note that you should pass the port number as an integer, though the library won’t complain if you pass a string instead.
Another way to connect to Redis is by using a specially formatted string, which represents a URL:
>>> from redis import Redis
>>> redis = Redis.from_url("redis://localhost:6379/")
>>> redis.incr("page_views")
7
This can be especially convenient if you want to store your Redis configuration in a file or environment variable.
Great! You can grab one of these code snippets and integrate it with your Flask web application. In the next section, you’ll see how to do just that.
Implement and Run the Flask Application Locally
Go back to your code editor, open the app module in your page-tracker project, and write the following few lines of Python code:
# src/page_tracker/app.py

from flask import Flask
from redis import Redis

app = Flask(__name__)
redis = Redis()

@app.get("/")
def index():
    page_views = redis.incr("page_views")
    return f"This page has been seen {page_views} times."
You start by importing Flask and Redis from your project’s respective third-party libraries listed as dependencies. Next, you instantiate a Flask application and a Redis client using default arguments, which means that the client will try connecting to a local Redis server. Finally, you define a controller function to handle HTTP GET requests arriving at the web server’s root address (/).
Your endpoint increments the number of page views in Redis and displays a suitable message in the client’s web browser. That’s it! You have a complete web application that can handle HTTP traffic and persist state in a remote data store using fewer than ten lines of code.
To verify if your Flask application is working as expected, issue the following command in the terminal:
(page-tracker) $ flask --app page_tracker.app run
 * Serving Flask app 'page_tracker.app'
 * Debug mode: off
WARNING: This is a development server. Do not use it in a production
⮑ deployment. Use a production WSGI server instead.
 * Running on http://127.0.0.1:5000
Press CTRL+C to quit
You can run this command anywhere in your file system as long as you’ve activated the correct virtual environment with your page-tracker package installed. This should run the Flask development server on localhost and port 5000 with debug mode disabled.
If you’d like to access your server from another computer on the same network, then you must bind it to all network interfaces by using the special address 0.0.0.0 instead of the default localhost, which represents the loopback interface:
(page-tracker) $ flask --app page_tracker.app run --host=0.0.0.0 \
                                                  --port=8080 \
                                                  --debug
 * Serving Flask app 'page_tracker.app'
 * Debug mode: on
WARNING: This is a development server. Do not use it in a production
⮑ deployment. Use a production WSGI server instead.
 * Running on all addresses (0.0.0.0)
 * Running on http://127.0.0.1:8080
 * Running on http://192.168.0.115:8080
Press CTRL+C to quit
 * Restarting with stat
 * Debugger is active!
 * Debugger PIN: 123-167-546
You can also change the port number and enable debug mode with an appropriate command-line option or flag if you want to.
Once you’ve started the server, you can follow the link displayed in the terminal and see the page with the number of views in your web browser. Every time you refresh this page, the counter should increase by one:
Nicely done! You’ve managed to create a bare-bones Flask application that tracks the number of page views using Redis. Next up, you’ll learn how to test and secure your web application.
Test and Secure Your Web Application
Before packaging and deploying any project to production, you should thoroughly test, examine, and secure the underlying source code. In this part of the tutorial, you’ll exercise unit, integration, and end-to-end tests. You’ll also perform static code analysis and security scanning to identify potential issues and vulnerabilities when it’s still cheap to fix them.
Cover the Source Code With Unit Tests
Unit testing involves testing a program’s individual units or components to ensure that they work as expected. It has become a necessary part of software development these days. Many engineers even take it a step further, rigorously following the test-driven development methodology by writing their unit tests first to drive the code design.
When it comes to writing unit tests, it’s quite common for those in the Python community to choose pytest over the standard library’s unittest module. Thanks to the relative simplicity of pytest, this testing framework is quick to start with. Go ahead and add pytest as an optional dependency to your project:
# pyproject.toml

[build-system]
requires = ["setuptools>=67.0.0", "wheel"]
build-backend = "setuptools.build_meta"

[project]
name = "page-tracker"
version = "1.0.0"
dependencies = [
    "Flask",
    "redis",
]

[project.optional-dependencies]
dev = [
    "pytest",
]
You can group optional dependencies that are somehow related under a common name. Here, for example, you created a group called dev to collect tools and libraries that you’ll use during development. By keeping pytest separate from the main dependencies, you’ll be able to install it on demand only when needed. After all, there’s no point in bundling your tests or the associated testing framework with the built distribution package.
Don’t forget to reinstall your Python package with the optional dependencies to get pytest into your project’s virtual environment:
(page-tracker) $ python -m pip install --editable ".[dev]"
You can use square brackets to list the names of optional dependency groups defined in your pyproject.toml file. In this case, you ask to install the dependencies for development purposes, including a testing framework. Note that using quotes ("") around the square brackets is recommended to prevent a potential filename expansion in the shell.
Because you followed the src layout in your project, you don’t have to keep the test modules either in the same folder or the same namespace package as your code under test. You can create a separate directory branch for your tests, as follows:
page-tracker/
│
├── src/
│   └── page_tracker/
│       ├── __init__.py
│       └── app.py
│
├── test/
│   └── unit/
│       └── test_app.py
│
├── venv/
│
├── constraints.txt
└── pyproject.toml
You’ve placed your test module in a test/unit/ folder to keep things organized. The pytest framework will discover your tests when you prefix them with the word test. Although you can change that, it’s customary to keep the default convention while mirroring each Python module with the corresponding test module. For example, you’ll cover the app module with test_app in your test/unit/ folder.
You’ll start by testing the happy path of your web application, which would typically mean sending a request to the server. Each Flask application comes with a convenient test client that you can use to make simulated HTTP requests. Because the test client doesn’t require a live server to be running, your unit tests will execute much faster and will become more isolated.
You can get the test client and conveniently wrap it in a test fixture to make it available to your test functions:
# test/unit/test_app.py

import pytest

from page_tracker.app import app

@pytest.fixture
def http_client():
    return app.test_client()
First, you import the pytest package to take advantage of its @fixture decorator against your custom function. Choose your function’s name carefully because it’ll also become the name of the fixture that you can pass around as an argument to the individual test functions. You also import the Flask application from your page_tracker package to get the corresponding test client instance.
When you intend to write a unit test, you must always isolate it by eliminating any dependencies that your unit of code may have. This means that you should mock or stub out any external services, databases, or libraries that your code relies on. In your case, the Redis server is such a dependency.
Unfortunately, your code currently uses a hard-coded Redis client, which prevents mocking. This is a good argument for following test-driven development from the start, but it doesn’t mean you have to go back and start over. Instead, you’re going to refactor your code by implementing the dependency injection design pattern:
 # src/page_tracker/app.py

+from functools import cache

 from flask import Flask
 from redis import Redis

 app = Flask(__name__)
-redis = Redis()

 @app.get("/")
 def index():
-    page_views = redis.incr("page_views")
+    page_views = redis().incr("page_views")
     return f"This page has been seen {page_views} times."

+@cache
+def redis():
+    return Redis()
Essentially, you move the Redis client creation code from the global scope to a new redis() function, which your controller function calls at runtime on each incoming request. This will allow your test case to substitute the returned Redis instance with a mock counterpart at the right time. But, to ensure that there’s only one instance of the client in memory, effectively making it a singleton, you also cache the result of your new function.
Go back to your test module now and implement the following unit test:
# test/unit/test_app.py

import unittest.mock

import pytest

from page_tracker.app import app

@pytest.fixture
def http_client():
    return app.test_client()

@unittest.mock.patch("page_tracker.app.redis")
def test_should_call_redis_incr(mock_redis, http_client):
    # Given
    mock_redis.return_value.incr.return_value = 5

    # When
    response = http_client.get("/")

    # Then
    assert response.status_code == 200
    assert response.text == "This page has been seen 5 times."
    mock_redis.return_value.incr.assert_called_once_with("page_views")
You wrap your test function with Python’s @patch decorator to inject a mocked Redis client into it as an argument. You also tell pytest to inject your HTTP test client fixture as another argument. The test function has a descriptive name that starts with the verb should and follows the Given-When-Then pattern. Both of these conventions, commonly used in behavior-driven development, make your test read as behavioral specifications.
In your test case, you first set up the mock Redis client to always return 5 whenever its .incr() method gets called. Then, you make a forged HTTP request to the root endpoint (/) and check the server’s response status and body. Because mocking helps you test the behavior of your unit, you only verify that the server calls the correct method with the expected argument, trusting that the Redis client library works correctly.
To execute your unit tests, you can either use the test runner integrated in your code editor, or you can type the following command in the terminal:
(page-tracker) $ python -m pytest -v test/unit/
You run pytest as a Python module from your virtual environment, instructing it to scan the test/unit/ directory in order to look for test modules there. The -v switch increases the test report’s verbosity so that you can see more details about the individual test cases.
Staring at a green report after all your unit tests have passed can feel satisfying. It gives you some level of confidence in your code, but it’s hardly enough to make any sort of guarantees. Plenty of memes illustrate the importance of running integration tests even after unit tests have passed.
For example, one of the classic memes shows two drawers, but only one can open at a time. While each individual drawer or unit has been tested and works on its own, it’s when you try integrating them into a piece of furniture that problems arise. Next up, you’ll add a rudimentary integration test to your project.
Check Component Interactions Through Integration Tests
Integration testing should be the next phase after running your unit tests. The goal of integration testing is to check how your components interact with each other as parts of a larger system. For example, your page tracker web application might have integration tests that check the communication with a genuine Redis server instead of a mocked one.
You can reuse pytest to implement and run the integration tests. However, you’ll install an additional pytest-timeout plugin to allow you to force the failure of test cases that take too long to run:
# pyproject.toml

[build-system]
requires = ["setuptools>=67.0.0", "wheel"]
build-backend = "setuptools.build_meta"

[project]
name = "page-tracker"
version = "1.0.0"
dependencies = [
    "Flask",
    "redis",
]

[project.optional-dependencies]
dev = [
    "pytest",
    "pytest-timeout",
]
Ideally, you don’t need to worry about unit tests timing out because they should be optimized for speed. On the other hand, integration tests will take longer to run and could hang infinitely on a stalled network connection, preventing your test suite from finishing. So, it’s important to have a way to abort them in cases like this.
Remember to reinstall your package with optional dependencies once again to make the pytest-timeout plugin available:
(page-tracker) $ python -m pip install --editable ".[dev]"
Before moving on, add another subfolder for your integration tests and define a conftest.py file in your test/ folder:
page-tracker/
│
├── src/
│   └── page_tracker/
│       ├── __init__.py
│       └── app.py
│
├── test/
│   ├── integration/
│   │   └── test_app_redis.py
│   │
│   ├── unit/
│   │   └── test_app.py
│   │
│   └── conftest.py
│
├── venv/
│
├── constraints.txt
└── pyproject.toml
You’ll place common fixtures in conftest.py, which different types of tests will share.
While your web application has just one component, you can think of Redis as another component that Flask needs to work with. Therefore, an integration test might look similar to your unit test, except that the Redis client won’t be mocked anymore:
# test/integration/test_app_redis.py

import pytest

@pytest.mark.timeout(1.5)
def test_should_update_redis(redis_client, http_client):
    # Given
    redis_client.set("page_views", 4)

    # When
    response = http_client.get("/")

    # Then
    assert response.status_code == 200
    assert response.text == "This page has been seen 5 times."
    assert redis_client.get("page_views") == b"5"
Conceptually, your new test case consists of the same steps as before, but it interacts with the real Redis server. That’s why you give the test at most 1.5 seconds to finish using the @pytest.mark.timeout decorator. The test function takes two fixtures as parameters:
- A Redis client connected to a local data store
- Flask’s test client hooked to your web application
To make the second one available in your integration test as well, you must move the http_client() fixture from the test_app module to the conftest.py file:
# test/conftest.py

import pytest
import redis

from page_tracker.app import app

@pytest.fixture
def http_client():
    return app.test_client()

@pytest.fixture(scope="module")
def redis_client():
    return redis.Redis()
Because this file is located one level up in the folder hierarchy, pytest will pick up all the fixtures defined in it and make them visible throughout your nested folders. Apart from the familiar http_client() fixture, which you moved from another Python module, you define a new fixture that returns a default Redis client. Notice that you give it the scope module to reuse the same Redis client instance for all functions within a test module.
To perform your integration test, you’ll have to double-check that a Redis server is running locally on the default port, 6379, and then start pytest as before, but point it to the folder with your integration tests:
(page-tracker) $ python -m pytest -v test/integration/
Because your integration test connects to an actual Redis server, it’ll overwrite the value that you might have previously stored under the page_views key. However, if the Redis server isn’t running while your integration tests are executing, or if Redis is running elsewhere, then your test will fail. This failure may be for the wrong reasons, making the outcome a false negative error, as your code might actually be working as expected.
To observe this problem, stop Redis now and rerun your integration test:
(page-tracker) $ docker stop redis-server
redis-server
(page-tracker) $ python -m pytest -v test/integration/
⋮
========================= short test summary info ==========================
FAILED test/integration/test_app_redis.py::test_should_update_redis -
⮑redis.exceptions.ConnectionError: Error 111 connecting to localhost:6379.
⮑Connection refused
============================ 1 failed in 0.19s =============================
This uncovers an issue in your code, which doesn’t gracefully handle Redis connection errors at the moment. In the spirit of test-driven development, you may first codify a test case that reproduces that problem and then fix it. Switch gears for a moment and add the following unit test in your test_app module with a mocked Redis client:
# test/unit/test_app.py

import unittest.mock

from redis import ConnectionError

# ...

@unittest.mock.patch("page_tracker.app.redis")
def test_should_handle_redis_connection_error(mock_redis, http_client):
    # Given
    mock_redis.return_value.incr.side_effect = ConnectionError

    # When
    response = http_client.get("/")

    # Then
    assert response.status_code == 500
    assert response.text == "Sorry, something went wrong \N{pensive face}"
You set the mocked .incr() method’s side effect so that calling that method will raise the redis.ConnectionError exception, which you observed when the integration test failed. Your new unit test, which is an example of a negative test, expects Flask to respond with an HTTP status code 500 and a descriptive message. Here’s how you can satisfy that unit test:
# src/page_tracker/app.py

from functools import cache

from flask import Flask
from redis import Redis, RedisError

app = Flask(__name__)

@app.get("/")
def index():
    try:
        page_views = redis().incr("page_views")
    except RedisError:
        app.logger.exception("Redis error")
        return "Sorry, something went wrong \N{pensive face}", 500
    else:
        return f"This page has been seen {page_views} times."

@cache
def redis():
    return Redis()
You intercept the top-level exception class, redis.RedisError, which is the ancestor of all exception types raised by the Redis client. If anything goes wrong, then you return the expected HTTP status code and a message. For convenience, you also log the exception using the logger built into Flask.
Note: While a parent is the immediate base class that a child class is directly extending, an ancestor can be anywhere further up the inheritance hierarchy.
Great! You amended your unit tests, implemented an integration test, and fixed a defect in your code after finding out about it, thanks to testing. Nonetheless, when you deploy your application to a remote environment, how will you know that all the pieces fit together and everything works as expected?
In the next section, you’ll simulate a real-world scenario by performing an end-to-end test against your actual Flask server rather than the test client.
Test a Real-World Scenario End to End (E2E)
End-to-end testing, also known as broad stack testing, encompasses many kinds of tests that can help you verify the system as a whole. They put the complete software stack to the test by simulating an actual user’s flow through the application. Therefore, end-to-end testing requires a deployment environment that mimics the production environment as closely as possible. A dedicated team of test engineers is usually needed, too.
Note: Because end-to-end tests have a high maintenance cost and tend to take a lot time to set up and run, they sit atop Google’s testing pyramid. In other words, you should aim for more integration tests, and even more unit tests in your projects.
As you’ll eventually want to build a full-fledged continuous integration pipeline for your Docker application, having some end-to-end tests in place will become essential. Start by adding another subfolder for your E2E tests:
page-tracker/
│
├── src/
│   └── page_tracker/
│       ├── __init__.py
│       └── app.py
│
├── test/
│   ├── e2e/
│   │   └── test_app_redis_http.py
│   │
│   ├── integration/
│   │   └── test_app_redis.py
│   │
│   ├── unit/
│   │   └── test_app.py
│   │
│   └── conftest.py
│
├── venv/
│
├── constraints.txt
└── pyproject.toml
The test scenario that you’re about to implement will look similar to your integration test. The main difference, though, is that you’ll be sending an actual HTTP request through the network to a live web server instead of relying on Flask’s test client. To do so, you’ll use the third-party requests library, which you must first specify in your pyproject.toml file as another optional dependency:
# pyproject.toml

[build-system]
requires = ["setuptools>=67.0.0", "wheel"]
build-backend = "setuptools.build_meta"

[project]
name = "page-tracker"
version = "1.0.0"
dependencies = [
    "Flask",
    "redis",
]

[project.optional-dependencies]
dev = [
    "pytest",
    "pytest-timeout",
    "requests",
]
You won’t be using requests to run your server in production, so there’s no need to require it as a regular dependency. Again, reinstall your Python package with optional dependencies using the editable mode:
(page-tracker) $ python -m pip install --editable ".[dev]"
You can now use the installed requests library in your end-to-end test:
 1# test/e2e/test_app_redis_http.py
 2
 3import pytest
 4import requests
 5
 6@pytest.mark.timeout(1.5)
 7def test_should_update_redis(redis_client, flask_url):
 8    # Given
 9    redis_client.set("page_views", 4)
10
11    # When
12    response = requests.get(flask_url)
13
14    # Then
15    assert response.status_code == 200
16    assert response.text == "This page has been seen 5 times."
17    assert redis_client.get("page_views") == b"5"
This code is nearly identical to your integration test except for line 12, which is responsible for sending an HTTP GET request. Previously, you sent that request to the test client’s root address, denoted with a slash character (/). Now, you don’t know the exact domain or IP address of the Flask server, which may be running on a remote host. Therefore, your function receives a Flask URL as an argument, which pytest injects as a fixture.
You may provide the specific web server’s address through the command line. Similarly, your Redis server may be running on a different host, so you’ll want to provide its address as a command-line argument as well. But wait! Your Flask application currently expects Redis to always run on the localhost. Go ahead and update your code to make this configurable:
# src/page_tracker/app.py

import os
from functools import cache

from flask import Flask
from redis import Redis, RedisError

app = Flask(__name__)

@app.get("/")
def index():
    try:
        page_views = redis().incr("page_views")
    except RedisError:
        app.logger.exception("Redis error")
        return "Sorry, something went wrong \N{pensive face}", 500
    else:
        return f"This page has been seen {page_views} times."

@cache
def redis():
    return Redis.from_url(os.getenv("REDIS_URL", "redis://localhost:6379"))
It’s common to use environment variables for setting sensitive data, such as a database URL, because it provides an extra level of security and flexibility. In this case, your program expects a custom REDIS_URL variable to exist. If that variable isn’t specified in the given environment, then you fall back to the default host and port.
To extend pytest with custom command-line arguments, you must edit conftest.py and hook into the framework’s argument parser in the following way:
# test/conftest.py

import pytest
import redis

from page_tracker.app import app

def pytest_addoption(parser):
    parser.addoption("--flask-url")
    parser.addoption("--redis-url")

@pytest.fixture(scope="session")
def flask_url(request):
    return request.config.getoption("--flask-url")

@pytest.fixture(scope="session")
def redis_url(request):
    return request.config.getoption("--redis-url")

@pytest.fixture
def http_client():
    return app.test_client()

@pytest.fixture(scope="module")
def redis_client(redis_url):
    if redis_url:
        return redis.Redis.from_url(redis_url)
    return redis.Redis()
You define two optional arguments, --flask-url and --redis-url, using syntax similar to Python’s argparse module. Then, you wrap these arguments in session-scoped fixtures, which you’ll be able to inject into your test functions and other fixtures. Specifically, your existing redis_client() fixture now takes advantage of the optional Redis URL.
Note: Because your end-to-end and integration tests rely on the same redis_client() fixture, you’ll be able to connect to a remote Redis server by specifying the --redis-url option in both types of tests.
This is how you can run your end-to-end test with pytest by specifying the URL of the Flask web server and the corresponding Redis server:
(page-tracker) $ python -m pytest -v test/e2e/ \
  --flask-url http://127.0.0.1:5000 \
  --redis-url redis://127.0.0.1:6379
In this case, you can access both Flask and Redis through localhost (127.0.0.1), but your application could be deployed to a geographically distributed environment consisting of multiple remote machines. When you execute this command locally, make sure that Redis is running and start your Flask server separately first:
(page-tracker) $ docker start redis-server
(page-tracker) $ flask --app page_tracker.app run
To improve the code quality, you can keep adding more types of tests to your application if you have the capacity. Still, that usually takes a team of full-time software quality assurance engineers. On the other hand, performing a code review or another type of static code analysis is fairly low-hanging fruit that can uncover surprisingly many problems. You’ll take a look at this process now.
Perform Static Code Analysis and Security Scanning
Now that your application works as expected, it’s time to perform static code analysis without executing the underlying code. It’s a common practice in the software development industry that helps developers identify potential software defects and security risks in their code. While some steps of static analysis can be automated, others are usually done manually through, for example, a peer review.
You’ll use the following automated tools, so please add them to your pyproject.toml file as optional dependencies:
# pyproject.toml

[build-system]
requires = ["setuptools>=67.0.0", "wheel"]
build-backend = "setuptools.build_meta"

[project]
name = "page-tracker"
version = "1.0.0"
dependencies = [
    "Flask",
    "redis",
]

[project.optional-dependencies]
dev = [
    "bandit",
    "black",
    "flake8",
    "isort",
    "pylint",
    "pytest",
    "pytest-timeout",
    "requests",
]
Don’t forget to reinstall and pin your dependencies afterward:
(page-tracker) $ python -m pip install --editable ".[dev]"
(page-tracker) $ python -m pip freeze --exclude-editable > constraints.txt
This will bring a few command-line utility tools into your virtual environment. First of all, you should clean up your code by formatting it consistently, sorting the import statements, and checking for PEP 8 compliance:
(page-tracker) $ python -m black src/ --check
would reformat /home/realpython/page-tracker/src/page_tracker/app.py

Oh no! 💥 💔 💥
1 file would be reformatted, 1 file would be left unchanged.

(page-tracker) $ python -m isort src/ --check
ERROR: /home/.../app.py Imports are incorrectly sorted and/or formatted.

(page-tracker) $ python -m flake8 src/
src/page_tracker/app.py:23:1: E302 expected 2 blank lines, found 1
You use black to flag any formatting inconsistencies in your code, isort to ensure that your import statements stay organized according to the official recommendation, and flake8 to check for any other PEP 8 style violations.
If you don’t see any output after running these tools, then it means there’s nothing to fix. On the other hand, if warnings or errors appear, then you can correct any reported problems by hand or let those tools do it automatically when you drop the --check flag:
(page-tracker) $ python -m black src/
reformatted /home/realpython/page-tracker/src/page_tracker/app.py

All done! ✨ 🍰 ✨
1 file reformatted, 1 file left unchanged.

(page-tracker) $ python -m isort src/
Fixing /home/realpython/page-tracker/src/page_tracker/app.py

(page-tracker) $ python -m flake8 src/
Without the --check flag, both black and isort go ahead and reformat the affected files in place without asking. Running these two commands also addresses PEP 8 compliance, as flake8 no longer returns any style violations.
Note: It’s useful to keep the code tidy by following common code style conventions across your team. This way, when one person updates a source file, team members won’t have to sort through changes to irrelevant parts of code, such as whitespace.
Once everything’s clean, you can lint your code to find potential code smells or ways to improve it:
(page-tracker) $ python -m pylint src/
When you run pylint against your web application’s source code, it may start complaining about more or less useful things. It generally emits messages belonging to a few categories, including:
- E: Errors
- W: Warnings
- C: Convention violations
- R: Refactoring suggestions
Each remark has a unique identifier, such as C0116, which you can suppress if you don’t find it helpful. You may include the suppressed identifiers in a global configuration file for a permanent effect or use a command-line switch to ignore certain errors on a given run. You can also add a specially formatted Python comment on a given line to account for special cases:
# src/page_tracker/app.py

import os
from functools import cache

from flask import Flask
from redis import Redis, RedisError

app = Flask(__name__)

@app.get("/")
def index():
    try:
        page_views = redis().incr("page_views")
    except RedisError:
        app.logger.exception("Redis error")  # pylint: disable=E1101
        return "Sorry, something went wrong \N{pensive face}", 500
    else:
        return f"This page has been seen {page_views} times."

@cache
def redis():
    return Redis.from_url(os.getenv("REDIS_URL", "redis://localhost:6379"))
In this case, you tell pylint to ignore a particular instance of the error E1101 without suppressing it completely. It’s a false positive because .logger is a dynamic attribute generated at runtime by Flask, which isn’t available during a static analysis pass.
Note: If you intend to use pylint as part of your automated continuous integration pipeline, then you may want to specify when it should exit with an error code, which would typically stop the subsequent steps of the pipeline. For example, you can configure it to always return a neutral exit code zero:
(page-tracker) $ python -m pylint src/ --exit-zero
This will never stop the pipeline from running, even when pylint finds some problems in the code. Alternatively, with --fail-under, you can specify an arbitrary score threshold at which pylint will exit with an error code.
You’ll notice that pylint gives a score to your code and keeps track of it. When you fix a problem one way or another and run the tool again, then it’ll report a new score and tell you how much it has improved or worsened. Use your best judgment to decide whether issues that pylint reports are worth fixing.
Finally, it’s too common to inadvertently leak sensitive data through your source code or expose other security vulnerabilities. It happens even to the best software engineers. Recently, GitHub exposed its private key in a public repository, which could’ve allowed attackers to impersonate the giant. To reduce the risk of such incidents, you should perform security or vulnerability scanning of your source code before deploying it anywhere.
To scan your code, you can use bandit, which you installed as an optional dependency earlier:
(page-tracker) $ python -m bandit -r src/
When you specify a path to a folder rather than to a file, then you must also include the -r flag to scan it recursively. At this point, bandit shouldn’t find any issues in your code. But, if you run it again after adding the following two lines at the bottom of your Flask application, then the tool will report issues with different severity levels:
# src/page_tracker/app.py

# ...

if __name__ == "__main__":
    app.run(host="0.0.0.0", port=5000, debug=True)
This name-main idiom is a common pattern found in many Flask applications because it makes development more convenient, letting you run the Python module directly. On the other hand, it exposes Flask’s debugger, allowing the execution of arbitrary code, and binding to all network interfaces through the address 0.0.0.0 opens up your service to public traffic.
Therefore, to make sure that your Flask application is secure, you should always run bandit or a similar tool before deploying the code to production.
Okay. Your web application is covered with the unit, integration, and end-to-end tests. That means a number of automated tools have statically analyzed and modified its source code. Next, you’ll continue on the path to continuous integration by wrapping the application in a Docker container so that you can deploy the whole project to a remote environment or faithfully replicate it on a local computer.
Dockerize Your Flask Web Application
In this section, you’ll run your page tracker web application as a Docker container that can speak to Redis running in another container. Such a setup is useful for development and testing as well as for deploying your application to a remote environment. Even if you haven’t installed Python or Redis on your computer, you’ll still be able to run your project through Docker.
Understand the Docker Terminology
Dockerizing an application involves creating a Dockerfile, which is a declarative description of the desired state of your environment. It provides a template for the runtime environment, configuration, and all the dependencies and libraries required to run your application.
To breathe life into your application, you must build a Docker image based on that description. You can think of a Docker image as a snapshot of your operating system at a given time. When you share your Docker image with the world or within your company, others can reproduce precisely the same environment and run the same application as you do. This sidesteps the classic but it works on my machine issue.
A Docker image is the blueprint for Docker containers. Each Docker container is an instance of your Docker image. A container has an independent state and resources, including its own file system, environment variables, and network interfaces. A single Docker container usually runs a single process, making it ideal for hosting a particular microservice.
By adding more containers, you can temporarily scale up one or more microservices to handle a peak in traffic, which could be typical during the holiday season, for example. However, your microservices must be well-architected and remain stateless for this to be effective.
Note: Docker containers resemble virtual machines like Vagrant or VirtualBox, but are much more lightweight and faster to spin up. As a result, you can run many more containers than virtual machines on your host machine simultaneously.
The reason for this is that containers have less overhead because they share your operating system’s kernel, while virtual machines run on a hypervisor that emulates the complete hardware stack. On the other hand, containers aren’t as secure, nor do they provide the same level of isolation as virtual machines.
Typical applications consist of multiple services running within isolated Docker containers that can communicate with each other. Your page tracker application has these two:
- Web service
- Redis service
You already know how to run Redis through Docker. Now, it’s time to sandbox your Flask web application within a Docker container to streamline the development and deployment process of both services.
Learn the Anatomy of a Dockerfile
To get started, you’ll define a relatively short Dockerfile that’s applicable in the development phase. Create a file named Dockerfile in your project root folder on the same level as the src/ subfolder and the pyproject.toml configuration file in the file hierarchy:
page-tracker/
│
├── src/
│   └── page_tracker/
│       ├── __init__.py
│       └── app.py
│
├── test/
│
├── venv/
│
├── constraints.txt
├── Dockerfile
└── pyproject.toml
You can name this file however you like, but sticking to the default naming convention will spare you from having to specify the filename each time you want to build an image. The default filename that Docker expects is Dockerfile with no file extension. Note that it starts with the capital letter D.
A Dockerfile is a plain text document that lists the steps necessary to assemble an image. It adheres to a specific format, which defines a fixed set of instructions for you to use.
Note: You must place each instruction in your Dockerfile on a separate line, but it’s not uncommon to see really long lines broken up several times with the line continuation character (\). In fact, cramming more than one operation on a single line is often desired to take advantage of the caching mechanism that you’ll learn about now.
When you build an image from a Dockerfile, you’re relying on a sequence of layers. Each instruction creates a read-only layer on top of the previous layer, encapsulating some modification to the image’s underlying file system. Layers have globally unique identifiers, which allow Docker to store the layers in a cache. This has two main advantages:
- Speed: Docker can skip layers that haven’t changed since the last build and load them from the cache instead, which leads to significantly faster image builds.
- Size: Multiple images can share common layers, which reduces their individual size. Other than that, having fewer layers contributes to the smaller image size.
Now that you know this layered anatomy of a Dockerfile, you can start adding instructions to it while learning about the best practices for creating efficient Docker images.
Choose the Base Docker Image
The first instruction in every Dockerfile, FROM, must always define the base image to build your new image from. This means that you don’t have to start from scratch but can pick a suitable image that’s already built. For example, you can use an image that ships with the Python interpreter:
# Dockerfile

FROM python:3.11.2-slim-bullseye
Here, you use the official Python image named python, which is hosted on Docker Hub. Official images are built and maintained by the official maintainers of the respective language or technology. They don’t belong to any particular user or team on Docker Hub but are available in the global namespace, implicitly called library/, as opposed to more specialized variants, like circleci/python.
You also specify an optional label or tag name after the colon (:) to narrow down the specific version of the base image. You can browse all the available tags of the given Docker image by clicking on the Tags tab on the corresponding Docker Hub page.
Note: Tags aren’t mandatory, but including them in the FROM instruction is considered best practice. You should be as specific as possible to avoid unwanted surprises. If you omit the tag, then Docker will pull an image tagged latest, which might contain an unsuitable operating system or unexpected changes in the runtime affecting your application.
The tag 3.11.2-slim-bullseye means that your base image will be a slimmed-down variant of Debian Bullseye with only the bare essentials, letting you install any additional packages later as needed. This reduces the image’s size and speeds up its download time. The difference in size between the regular and slim variants of this image is a whopping eight hundred megabytes!
The tag also indicates that your base image will ship with Python 3.11.2 already installed, so you can start using it right away.
The next task that you may want to do immediately after pulling a base image is to patch it with the most recent security updates and bug fixes, which may have been released since the image was published on Docker Hub:
# Dockerfile

FROM python:3.11.2-slim-bullseye

RUN apt-get update && \
    apt-get upgrade --yes
In Debian, you use the apt-get command to fetch the latest package list and upgrade any packages that have updates available. Notice that both commands are executed as part of one RUN instruction to minimize the number of layers in the file system, so you avoid taking up too much disk space.
Note: The order of instructions in your Dockerfile is important because it can affect how long it’ll take to build an image. In particular, you should place instructions whose layers often change toward the bottom of your Dockerfile because they’re most likely to invalidate all the subsequent layers in the cache.
Okay. You’ve chosen your base image and installed the most recent security updates. You’re almost ready to set up your Flask application, but there are still a few steps ahead.
Isolate Your Docker Image
Another good practice when working with Dockerfiles is to create and switch to a regular user without administrative privileges as soon as you don’t need them anymore. By default, Docker runs your commands as the superuser, which a malicious attacker could exploit to gain unrestricted access to your host system. Yes, Docker gives root-level access to the container and your host machine!
Here’s how you can avoid this potential security risk:
# Dockerfile

FROM python:3.11.2-slim-bullseye

RUN apt-get update && \
    apt-get upgrade --yes

RUN useradd --create-home realpython
USER realpython
WORKDIR /home/realpython
You create a new user named realpython and tell Docker to use that user in the Dockerfile from now on. You also set the current working directory to this user’s home directory so that you don’t have to specify the full file path explicitly in later commands.
Even though your Docker container will run a single Flask application, consider setting up a dedicated virtual environment inside the container itself. While you don’t need to worry about isolating multiple Python projects from each other, and Docker provides a reasonable insulation layer from your host machine, you still risk interfering with the container’s own system tools.
Unfortunately, many Linux distributions rely on the global Python installation to run smoothly. If you start installing packages directly into the global Python environment, then you open the door for potential version conflicts. That could even lead to breaking your system.
Note: If you’re still unconvinced about creating a virtual environment inside a Docker container, then maybe this warning message will change your mind:
WARNING: Running pip as the 'root' user can result in broken permissions
and conflicting behaviour with the system package manager. It is
⮑recommended to use a virtual environment instead:
⮑https://pip.pypa.io/warnings/venv
You may see this after trying to install a Python package using the system’s global pip command on Debian or a derived distribution like Ubuntu.
The most reliable way of creating and activating a virtual environment within your Docker image is to directly modify its PATH environment variable:
# Dockerfile

FROM python:3.11.2-slim-bullseye

RUN apt-get update && \
    apt-get upgrade --yes

RUN useradd --create-home realpython
USER realpython
WORKDIR /home/realpython

ENV VIRTUALENV=/home/realpython/venv
RUN python3 -m venv $VIRTUALENV
ENV PATH="$VIRTUALENV/bin:$PATH"
First, you define a helper variable, VIRTUALENV, with the path to your project’s virtual environment, and then use Python’s venv module to create that environment there. However, rather than activating your new environment with a shell script, you update the PATH variable by overriding the path to the python executable.
Why? This is necessary because activating your environment in the usual way would only be temporary and wouldn’t affect Docker containers derived from your image. Moreover, if you activated the virtual environment using Dockerfile’s RUN instruction, then it would only last until the next instruction in your Dockerfile because each one starts a new shell session.
Once you have the virtual environment for your project, you can install the necessary dependencies.
Cache Your Project Dependencies
Installing dependencies in a Dockerfile looks slightly different compared to working locally on your host machine. Normally, you’d install the dependencies and then your Python package immediately afterward. In contrast, when you build a Docker image, it’s worthwhile to split that process into two steps to leverage layer caching, reducing the total time it takes to build the image.
First, COPY the two files with the project metadata from your host machine into the Docker image:
# Dockerfile

FROM python:3.11.2-slim-bullseye

RUN apt-get update && \
    apt-get upgrade --yes

RUN useradd --create-home realpython
USER realpython
WORKDIR /home/realpython

ENV VIRTUALENV=/home/realpython/venv
RUN python3 -m venv $VIRTUALENV
ENV PATH="$VIRTUALENV/bin:$PATH"

COPY --chown=realpython pyproject.toml constraints.txt ./
You only copy the pyproject.toml and constraints.txt files, which contain information about the project’s dependencies, into the home directory of your realpython user in the Docker image. By default, files are owned by the superuser, so you may want to change their owner with --chown to a regular user that you created before. The --chown option is similar to the chown command, which stands for change owner.
Many Dockerfile examples that you can find online would copy everything in one go, but that’s wasteful! There might be a ton of extra files, such as your local Git repository with the project’s entire history, code editor settings, or other temporary files hanging around in your project root folder. Not only do they bloat the resulting image, but they also increase the likelihood of invalidating Docker’s layer cache prematurely.
Note: You should only copy the individual files that you need at the moment in your Dockerfile. Otherwise, even the slightest change in an unrelated file will cause your remaining layers to rebuild. Alternatively, you could define a .dockerignore file that works similarly to a .gitignore counterpart, but it’s safer to be explicit about what you want to copy.
Another piece of the puzzle that’s easy to miss is when you forget to upgrade pip itself before trying to install your project dependencies. In rare cases, an old version of pip can actually prevent the latest versions of other packages from installing! In your case, it’s also worth upgrading setuptools, which you use as a build back end, to get the newest security patches.
You can combine the following two commands in one RUN instruction to install your dependencies:
# Dockerfile

FROM python:3.11.2-slim-bullseye

RUN apt-get update && \
    apt-get upgrade --yes

RUN useradd --create-home realpython
USER realpython
WORKDIR /home/realpython

ENV VIRTUALENV=/home/realpython/venv
RUN python3 -m venv $VIRTUALENV
ENV PATH="$VIRTUALENV/bin:$PATH"

COPY --chown=realpython pyproject.toml constraints.txt ./
RUN python -m pip install --upgrade pip setuptools && \
    python -m pip install --no-cache-dir -c constraints.txt ".[dev]"
You upgrade pip and setuptools to their most recent versions. Then, you install the third-party libraries that your project requires, including optional dependencies for development. You constrain their versions to ensure a consistent environment, and you tell pip to disable caching with --no-cache-dir. You won’t need those packages outside your virtual environment, so there’s no need to cache them. That way, you make your Docker image smaller.
Note: Because you installed dependencies without installing your page-tracker package in the Docker image, they’ll stay in a cached layer. Therefore, any changes to your source code won’t require reinstalling those dependencies.
Your Dockerfile is growing and becoming more complex, but don’t worry. There are only a few more steps to complete, so you’re almost there.
Run Tests as Part of the Build Process
Finally, it’s time to copy your source code into the Docker image and run your tests along with linters and other static analysis tools:
# Dockerfile

FROM python:3.11.2-slim-bullseye

RUN apt-get update && \
    apt-get upgrade --yes

RUN useradd --create-home realpython
USER realpython
WORKDIR /home/realpython

ENV VIRTUALENV=/home/realpython/venv
RUN python3 -m venv $VIRTUALENV
ENV PATH="$VIRTUALENV/bin:$PATH"

COPY --chown=realpython pyproject.toml constraints.txt ./
RUN python -m pip install --upgrade pip setuptools && \
    python -m pip install --no-cache-dir -c constraints.txt ".[dev]"

COPY --chown=realpython src/ src/
COPY --chown=realpython test/ test/

RUN python -m pip install . -c constraints.txt && \
    python -m pytest test/unit/ && \
    python -m flake8 src/ && \
    python -m isort src/ --check && \
    python -m black src/ --check --quiet && \
    python -m pylint src/ --disable=C0114,C0116,R1705 && \
    python -m bandit -r src/ --quiet
After copying the src/ and test/ folders from your host machine, you install the page-tracker package into the virtual environment. By baking the automated testing tools into the build process, you ensure that if any one of them returns a non-zero exit status code, then building your Docker image will fail. That’s precisely what you want when implementing a continuous integration pipeline.
Note that you had to disable the low-severity pylint issues C0114, C0116, and R1705, which are of little importance now. Otherwise, they would prevent your Docker image from building successfully.
The reason for combining the individual commands in one RUN instruction is to reduce the number of layers to cache. Remember that the more layers you have, the bigger the resulting Docker image will be.
Note: At this point, you can’t execute the integration or end-to-end tests, which require Redis, because your Docker image only concerns the Flask application. You’ll be able to execute them after deploying your application to some environment.
When all the tests pass and none of the static analysis tools report any issues, your Docker image will be almost done. However, you still need to tell Docker what command to run when you create a new container from your image.
Specify the Command to Run in Docker Containers
The last step is specifying the command to execute inside each new Docker container derived from your Docker image. At this stage, you can start your web application on top of Flask’s built-in development server:
# Dockerfile

FROM python:3.11.2-slim-bullseye

RUN apt-get update && \
    apt-get upgrade --yes

RUN useradd --create-home realpython
USER realpython
WORKDIR /home/realpython

ENV VIRTUALENV=/home/realpython/venv
RUN python3 -m venv $VIRTUALENV
ENV PATH="$VIRTUALENV/bin:$PATH"

COPY --chown=realpython pyproject.toml constraints.txt ./
RUN python -m pip install --upgrade pip setuptools && \
    python -m pip install --no-cache-dir -c constraints.txt ".[dev]"

COPY --chown=realpython src/ src/
COPY --chown=realpython test/ test/

RUN python -m pip install . -c constraints.txt && \
    python -m pytest test/unit/ && \
    python -m flake8 src/ && \
    python -m isort src/ --check && \
    python -m black src/ --check --quiet && \
    python -m pylint src/ --disable=C0114,C0116,R1705 && \
    python -m bandit -r src/ --quiet

CMD ["flask", "--app", "page_tracker.app", "run", \
     "--host", "0.0.0.0", "--port", "5000"]
Here, you use one of the three forms of the CMD instruction, which resembles the syntax of Python’s subprocess.run() function. Note that you must bind the host to the 0.0.0.0 address in order to make your application accessible from outside the Docker container.
You can now build a Docker image based on your existing Dockerfile and start running Docker containers derived from it. The following command will turn your Dockerfile into a Docker image named page-tracker:
$ docker build -t page-tracker .
It’ll look for a Dockerfile in the current working directory, indicated by a dot (.), and tag the resulting image with the default label latest. So, the full image name will be page-tracker:latest.
Unfortunately, your image currently contains a lot of cruft, such as the source code, tests, and linters that you’ll never need in production. They increase the size of the image, making it slower to download and deploy, and they can also lead to security vulnerabilities if you don’t properly maintain them. Additionally, those extra components could cause problems when troubleshooting errors.
Fortunately, there’s a better way to organize your Dockerfile, allowing you to build an image in multiple stages, which you’ll explore now.
Reorganize Your Dockerfile for Multi-Stage Builds
The Dockerfile that you’ve created so far is fairly straightforward and should be fine for development. Keep it around, as you’ll need it later to run an end-to-end test with Docker Compose. You can duplicate this file now and give it a different name. For example, you can append the .dev suffix to one of the two copies:
page-tracker/
│
├── src/
│   └── page_tracker/
│       ├── __init__.py
│       └── app.py
│
├── test/
│
├── venv/
│
├── constraints.txt
├── Dockerfile
├── Dockerfile.dev
└── pyproject.toml
Now, edit the file named Dockerfile and keep it open while you break down the build process into stages.
Note: To specify a custom filename instead of the default Dockerfile when building an image, use the -f or --file option:
$ docker build -f Dockerfile.dev -t page-tracker .
This filename can be whatever you want. Just make sure you reference it correctly in the docker build command.
The idea behind multi-stage builds is to partition your Dockerfile into stages, each of which can be based on a completely different image. That’s particularly useful when your application’s development and runtime environments are different. For example, you can install the necessary build tools in a temporary image meant just for building and testing your application and then copy the resulting executable into the final image.
Multi-stage builds can make your images much smaller and more efficient. Here’s a comparison of the same image built with your current Dockerfile and the one that you’re about to write:
$ docker images
REPOSITORY     TAG       IMAGE ID       CREATED          SIZE
page-tracker   prod      9cb2e3233522   5 minutes ago    204MB
page-tracker   dev       f9918cb213dc   5 minutes ago    244MB
(...)
The size difference isn’t spectacular in this case, but it can quickly add up when you have multiple images to manage and move around.
Each stage in a Dockerfile begins with its own FROM instruction, so you’ll have two. The first stage will look almost exactly the same as your current Dockerfile, except that you’ll give this stage a name, builder, which you can refer to later:
 # Dockerfile

-FROM python:3.11.2-slim-bullseye
+FROM python:3.11.2-slim-bullseye AS builder

 RUN apt-get update && \
     apt-get upgrade --yes

 RUN useradd --create-home realpython
 USER realpython
 WORKDIR /home/realpython

 ENV VIRTUALENV=/home/realpython/venv
 RUN python3 -m venv $VIRTUALENV
 ENV PATH="$VIRTUALENV/bin:$PATH"

 COPY --chown=realpython pyproject.toml constraints.txt ./
 RUN python -m pip install --upgrade pip setuptools && \
     python -m pip install --no-cache-dir -c constraints.txt ".[dev]"

 COPY --chown=realpython src/ src/
 COPY --chown=realpython test/ test/

 RUN python -m pip install . -c constraints.txt && \
     python -m pytest test/unit/ && \
     python -m flake8 src/ && \
     python -m isort src/ --check && \
     python -m black src/ --check --quiet && \
     python -m pylint src/ --disable=C0114,C0116,R1705 && \
-    python -m bandit -r src/ --quiet
+    python -m bandit -r src/ --quiet && \
+    python -m pip wheel --wheel-dir dist/ . -c constraints.txt

-CMD ["flask", "--app", "page_tracker.app", "run", \
-     "--host", "0.0.0.0", "--port", "5000"]
Because you’ll be transferring your packaged page tracker application from one image to another, you must add the extra step of building a distribution package using the Python wheel format. The pip wheel command will create a file named something like page_tracker-1.0.0-py3-none-any.whl in the dist/ subfolder. You also remove the CMD instruction from this stage, as it’ll become part of the next stage.
The second and final stage, implicitly named stage-1, will look a little repetitive because it’s based on the same image:
# Dockerfile

FROM python:3.11.2-slim-bullseye AS builder

# ...

FROM python:3.11.2-slim-bullseye

RUN apt-get update && \
    apt-get upgrade --yes

RUN useradd --create-home realpython
USER realpython
WORKDIR /home/realpython

ENV VIRTUALENV=/home/realpython/venv
RUN python3 -m venv $VIRTUALENV
ENV PATH="$VIRTUALENV/bin:$PATH"

COPY --from=builder /home/realpython/dist/page_tracker*.whl /home/realpython

RUN python -m pip install --upgrade pip setuptools && \
    python -m pip install --no-cache-dir page_tracker*.whl

CMD ["flask", "--app", "page_tracker.app", "run", \
     "--host", "0.0.0.0", "--port", "5000"]
You start by following the familiar steps of upgrading the system packages, creating a user, and making a virtual environment. Then, the highlighted line is responsible for copying your wheel file from the builder stage. You install it with pip as before. Lastly, you add the CMD instruction to start your web application with Flask.
When you build an image with such a multi-stage Dockerfile, you’ll notice that the first stage takes longer to complete, as it has to install all the dependencies, run the tests, and create the wheel file. However, building the second stage will be quite a bit faster because it just has to copy and install the finished wheel file. Also, note that the builder stage is temporary, so there will be no trace of it in your Docker images afterward.
Okay. You’re finally ready to build your multi-stage Docker image!
Build and Version Your Docker Image
Before you build an image, it’s highly recommended that you pick a versioning scheme for your Docker images and consistently tag them with unique labels. That way, you’ll know what was deployed to any given environment and be able to perform a rollback to the previous stable version if needed.
There are a few different strategies for versioning your Docker images. For example, some popular ones include:
- Semantic versioning uses three numbers delimited with a dot to indicate the major, minor, and patch versions.
- Git commit hash uses the SHA-1 hash of a Git commit tied to the source code in your image.
- Timestamp uses temporal information, such as Unix time, to indicate when the image was built.
Nothing stops you from combining a few of these strategies to create an effective versioning system that will help you track the changes in your images.
In this tutorial, you’ll stick with the Git commit hash approach, as it ensures unique and immutable labels for your Docker images. Take a moment to initialize a local Git repository in your page-tracker/ folder, and define a .gitignore with file patterns relevant to your work environment. You can double-check if you’re in the right folder by printing your working directory using the pwd command:
Here, you download content from gitignore.io with curl, requesting that Git exclude Python and PyCharm-related file patterns from tracking. The -L flag is necessary to follow redirects because the website recently moved to a different address with a longer domain. Alternatively, you could grab one of the templates from GitHub’s gitignore repository, which some code editors use.
Once your local Git repository is initialized, you can make your first commit and get the corresponding hash value, for example, by using the git rev-parse command:
$ git add .
$ git commit -m "Initial commit"
[master (root-commit) dde1dc9] Initial commit
 11 files changed, 535 insertions(+)
 create mode 100644 .gitignore
 create mode 100644 Dockerfile
 create mode 100644 Dockerfile.dev
 create mode 100644 constraints.txt
 create mode 100644 pyproject.toml
 create mode 100644 src/page_tracker/__init__.py
 create mode 100644 src/page_tracker/app.py
 create mode 100644 test/conftest.py
 create mode 100644 test/e2e/test_app_redis_http.py
 create mode 100644 test/integration/test_app_redis.py
 create mode 100644 test/unit/test_app.py

$ git rev-parse HEAD
dde1dc9303a2a9f414d470d501572bdac29e4075
If you don’t like the long output, then you can add the --short flag to the command, which will give you an abbreviated version of the same commit hash:
$ git rev-parse --short HEAD
dde1dc9
By default, it’ll return the shortest prefix that can uniquely identify that particular commit without ambiguity.
Now that you have the Git commit hash in place, you can use it as the tag for your Docker image. To build the image, run the docker build command while specifying the -t or --tag option to give your new image a label. The trailing dot indicates your current working directory as the place to look for the Dockerfile:
$ docker build -t page-tracker:$(git rev-parse --short HEAD) .
The first part up to the colon, page-tracker, is a mnemonic name of your Docker image. Note that in real life, you’d probably append some kind of suffix to communicate the role of this service. For example, because this is a Flask web application, you could name your image page-tracker-web or something along those lines. What comes after the colon is the actual tag, which, in this case, is the Git commit hash from the current commit.
If you previously built your Docker image without giving it explicit tags or if you tagged it otherwise, then you may notice that building it now only takes a fraction of a second! That’s because Docker cached every file system layer, and as long as no important files in your project had changed, there was no need to rebuild those layers.
Another point worth noticing is that, under the surface, Docker stores only one copy of your image. It has a unique identifier, such as 9cb2e3233522, which multiple labels can refer to:
$ docker images
REPOSITORY     TAG                    IMAGE ID       CREATED       SIZE
page-tracker   dde1dc9                9cb2e3233522   1 hour ago    204MB
page-tracker   prod                   9cb2e3233522   1 hour ago    204MB
page-tracker   dev                    f9918cb213dc   1 hour ago    244MB
(...)
That’s the power of tagging your Docker images. It allows you to refer to the same image with different labels, such as page-tracker:prod or page-tracker:dde1dc9, while preserving a unique identity. Each label consists of the repository name, which you’ll learn about in the next section, and a specific tag name.
You can now use your shiny new Docker image, which you built from your Dockerfile, to start a full-fledged Docker container. Specifically, you may run the container locally on your laptop or in a remote cloud-based server that supports Docker. It could be your only way to exercise the end-to-end tests.
But how do you get the container onto a remote environment? You’ll find out in the next section.
Push the Image to a Docker Registry
When you collaborate with others on a piece of code, you typically use some version control like Git to keep track of all the changes made by everyone involved. While Git itself is a distributed version control system that allows you to integrate contributions between any two individuals, it lacks a centralized hosting service to facilitate simultaneous collaboration between multiple parties. That’s why most people choose GitHub or competitors.
While GitHub is where you typically upload your source code, Docker Registry is the usual place for storing your built Docker images. Companies working on commercial products will want to set up their own Docker Registry in a private cloud or on premises for an extra level of control and security. Many popular cloud providers offer highly secure Docker Registries in the form of a managed service.
You can use a private registry too, by running the open-source distribution container through Docker, for example.
Alternatively, if that’s too much of a hassle, then you’ll be happy to learn that Docker Hub offers a secure and hosted registry that you can start using for free. While the free tier gives you an unlimited number of public repositories, you’ll only have one private repository that will remain invisible to the outside world. That sounds like a good deal for personal or hobby projects, considering that you don’t have to pay a dime.
Note: A repository on your Docker Hub account is a collection of Docker images that users can upload or download. Each repository can contain multiple tagged versions of the same image. In this regard, a Docker Hub repository is analogous to a GitHub repository but specifically for Docker images rather than code. Private repositories let you restrict access to authorized users only, whereas public repositories are available to everyone.
Why would you want to use a Docker Registry at all?
Well, you don’t have to, but it helps to share Docker images across an organization or set up a continuous integration pipeline. For example, pushing a commit to GitHub or another source code revision system could kick off the build process through an autobuild feature. In turn, the registry would announce that a new Docker image was successfully built or use a webhook to start the deployment to a remote environment for further testing.
Register an account on Docker Hub now if haven’t already. Note that you’ll need to provide your unique username in addition to an email address and password, just like on GitHub:
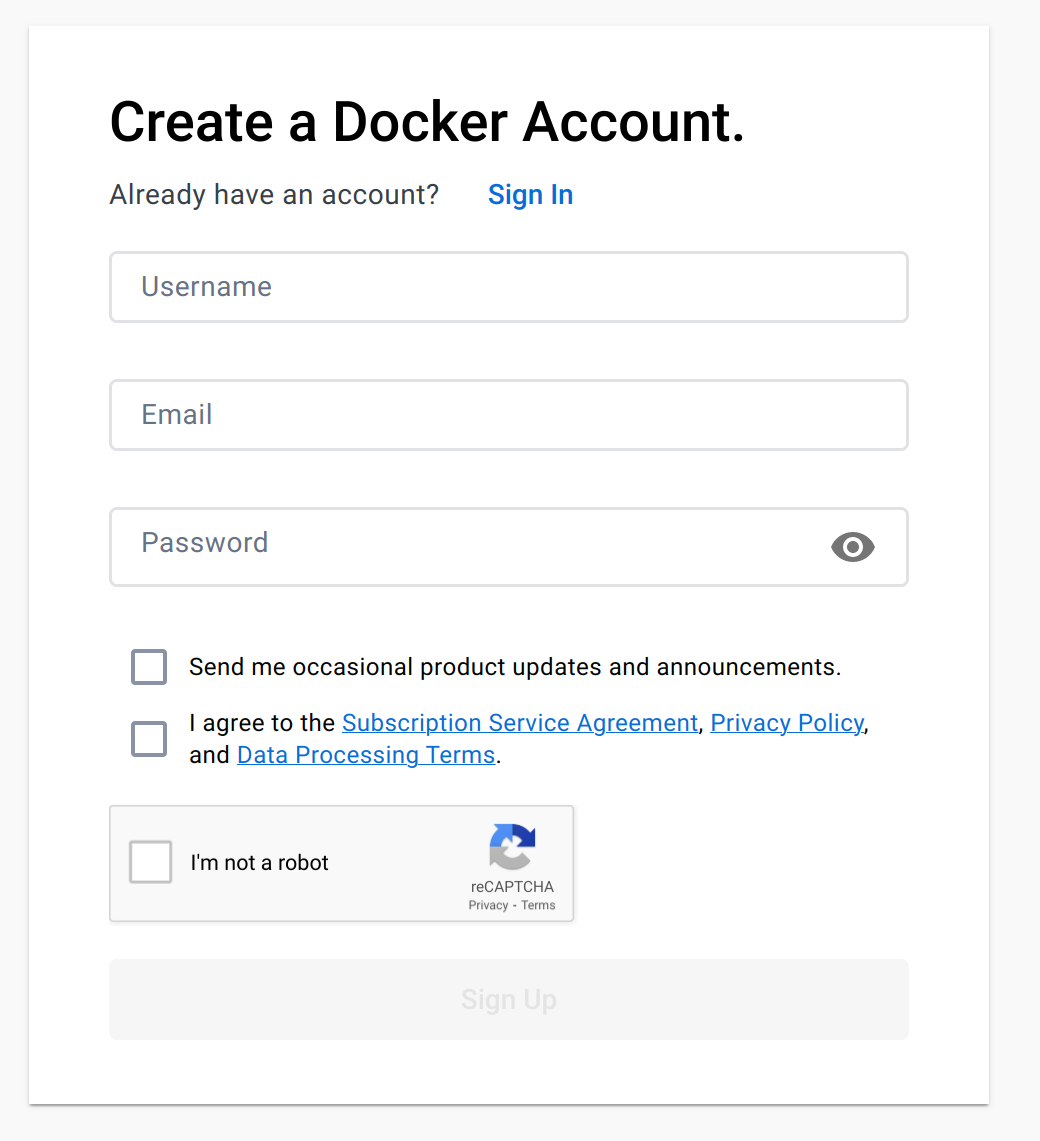
Choosing a good and memorable username is vital because it’ll become your distinctive handle on Docker Hub. To avoid name conflicts between images owned by different users, Docker Hub recognizes each repository by a combination of the username and repository name. For example, if your username is realpython, then one of your repositories could be identified by the string realpython/page-tracker, which resembles a repository’s name on GitHub.
The first thing you should do after signing up and logging into your new Docker Hub account in the web browser is to create a repository for your images. Click the Create a Repository tile or go to the Repositories tab in the navigation bar at the top and click the Create repository button. Then, name your repository page-tracker, give it a meaningful description if you want, and select the Private option to make it visible to only you:
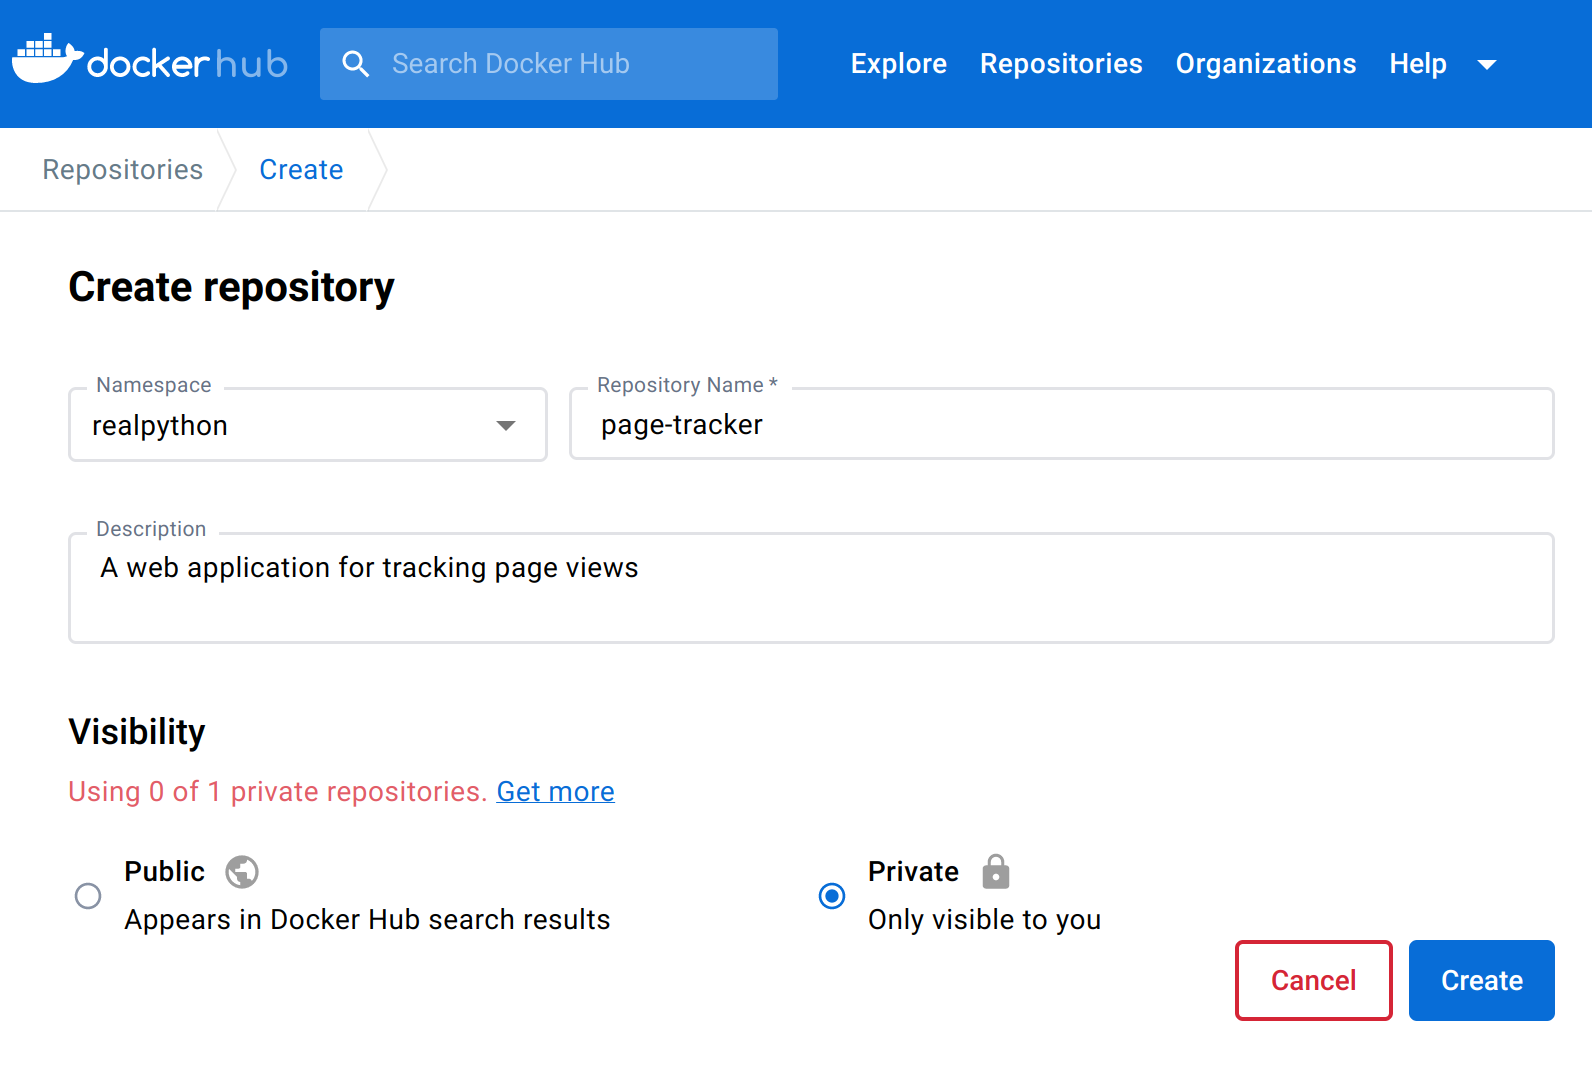
Afterward, you’ll see instructions with terminal commands that will allow you to push Docker images to your repository. But first, you’ll have to log in to Docker Hub from the command line, providing your username and password:
$ docker login -u realpython
Password:
Authenticating with docker login is required even when you intend to work with your public repositories only.
Note: If you enabled two-factor authentication in your Docker Hub account’s security settings, then you’ll need to generate an access token with appropriate permissions to log in with docker in the command line. When it asks you for the password, just provide your token instead.
Otherwise, if you don’t have two-factor authentication configured, then you’ll be able to log in with your Docker Hub password. Nevertheless, it’s still worth generating a token for better security, as the documentation explains.
When you push code to a remote repository with Git, you must first clone it from somewhere or manually set the default origin, which configures the local repository’s metadata. In contrast, with Docker Hub or any other Docker registry, the process of mapping a local image onto its remote counterpart is a bit different—you use tagging. Specifically, you tag the built image using your Docker Hub’s username and repository name as a prefix.
First, you must provide the source label, such as page-tracker:dde1dc9, of a local Docker image that you wish to publish. To find the exact label of your page-tracker image that you just built, check your current Git commit hash or list your existing docker images.
Once you know how you tagged your image, use the same commit hash to build the target label that will identify your repository in the Docker registry. Remember to replace realpython with your own Docker Hub username before creating a new tag:
$ docker tag page-tracker:dde1dc9 realpython/page-tracker:dde1dc9
This will add a new label, realpython/page-tracker:dde1dc9, to your local image tagged as page-tracker:dde1dc9. The complete form of the target label looks as follows:
registry/username/repository:tag
The registry part can be left out when you want to push to the default Docker Hub. Otherwise, it can be a domain address, such as docker.io, or an IP address with an optional port number of your private registry instance. The username and repository must correspond to the ones that you created on Docker Hub or whatever registry you use. If you don’t provide the tag, then Docker will implicitly apply the tag latest, which may be undefined.
You can tag the same image with more than one tag:
$ docker tag page-tracker:dde1dc9 realpython/page-tracker:latest
Once you’ve correctly tagged the images, you can send them to the desired registry with docker push:
$ docker push realpython/page-tracker:dde1dc9
$ docker push realpython/page-tracker:latest
Don’t worry about sending the same image twice. Docker is clever enough to know when you’ve pushed an image before and will transfer only the necessary metadata if it detects that image in the registry.
When you refresh your profile on Docker Hub, it should reflect the two tags that you just pushed into your repository:
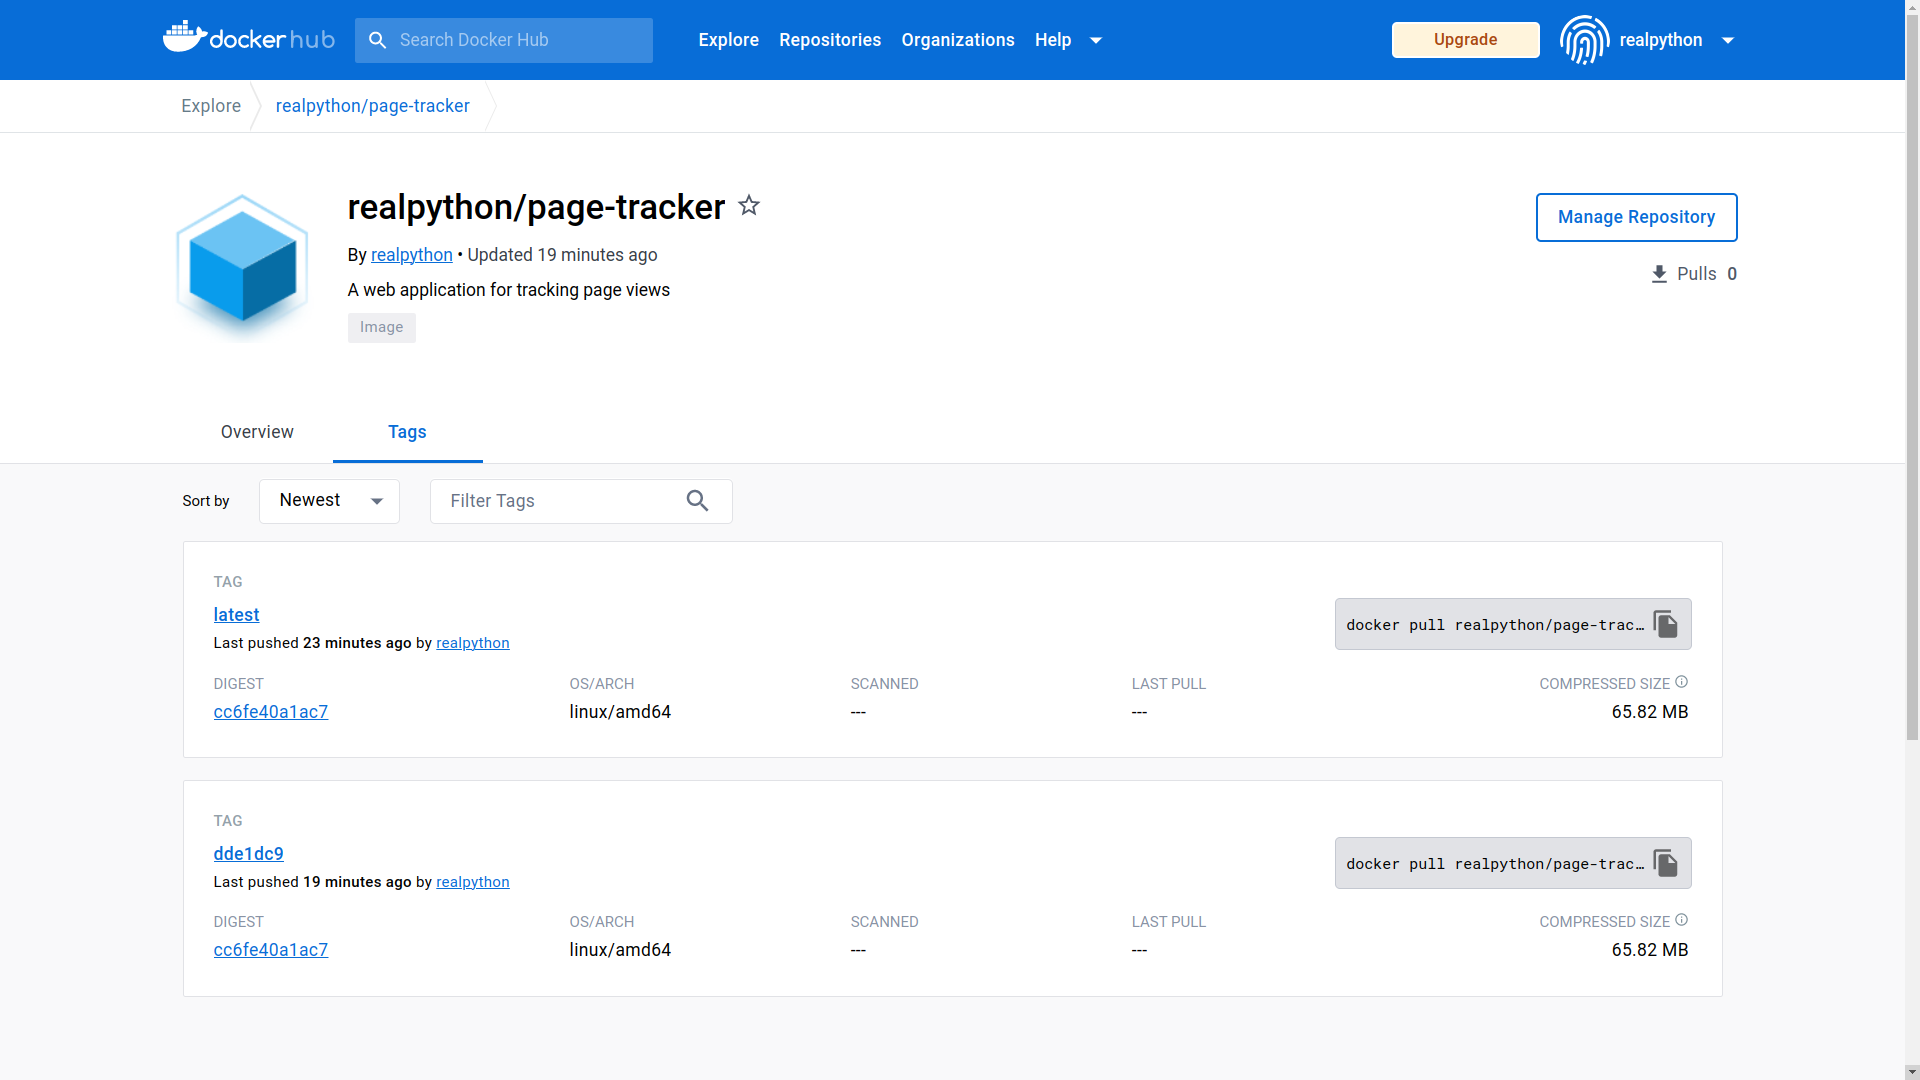
Now, when you add collaborators to your private repository, they’ll be able to push or pull images. Bear in mind this requires an upgraded subscription plan on Docker Hub. The alternative would be generating an access token with read-only permissions to all your repositories or creating a public repository instead.
All right. It’s finally time to give your dockerized Flask web application a spin by running it in a Docker container.
Run a Docker Container
If you start on a clean Docker environment, perhaps on another computer, then you can download your image by pulling it from Docker Hub, as long as you have permission to read that repository:
$ docker pull realpython/page-tracker
Using default tag: latest
latest: Pulling from realpython/page-tracker
f1f26f570256: Pull complete
2d2b01660885: Pull complete
e4e8e4c0b0e1: Pull complete
1ba60f086308: Pull complete
3c2fccf90be1: Pull complete
15e9066b1610: Pull complete
e8271c9a01cc: Pull complete
4f4fb700ef54: Pull complete
bb211d339643: Pull complete
8690f9a37c37: Pull complete
7404f1e120d1: Pull complete
Digest: sha256:cc6fe40a1ac73e6378d0660bf386a1599880a30e422dc061680769bc4d501164
Status: Downloaded newer image for realpython/page-tracker:latest
docker.io/realpython/page-tracker:latest
As you haven’t specified any tag for the image, Docker pulls the one labeled latest. Notice that the output also includes the identifiers of the image’s individual layers, corresponding to the eleven instructions from your original Dockerfile used to build that image.
You don’t have to manually pull images, though, because Docker will do it for you when you first try running them. If the specified image is already in the cache, then a new container will start immediately without waiting until the download completes.
Here’s the command to run a new Docker container based on your new image:
$ docker run -p 80:5000 --name web-service realpython/page-tracker
 * Serving Flask app 'page_tracker.app'
 * Debug mode: off
WARNING: This is a development server. Do not use it in a production
⮑ deployment. Use a production WSGI server instead.
 * Running on all addresses (0.0.0.0)
 * Running on http://127.0.0.1:5000
 * Running on http://172.17.0.3:5000
Press CTRL+C to quit
When you develop your project locally, it’s often convenient to use port forwarding to access the web server through your host machine’s localhost. In this case, the -p option will let you navigate to the address http://localhost:80 or just http://localhost without knowing the exact IP address of the running Docker container. Port 80 is the HTTP protocol’s default port, meaning you can omit it when typing an address into a web browser.
Moreover, this port mapping will ensure that there’s no network port collision at http://localhost:5000 in case you haven’t stopped your local instance of Flask. Remember that you previously started one to perform your end-to-end test. It’ll occupy Flask’s default port, 5000, if the process is still running somewhere in the background.
Note: It’s also useful to give your Docker container a descriptive name, such as web-service, so that you can restart or remove it by name without looking up the corresponding container identifier. If you don’t, then Docker will give your container a goofy name like admiring_jang or frosty_almeida picked at random.
Consider adding the --rm flag to automatically remove the container when it stops if you don’t want to do it by hand.
As you can see in the output above, the Flask server is running on all network interfaces (0.0.0.0) within its container, just as you instructed in the CMD layer in your Dockerfile.
Go ahead and visit the address http://localhost in your web browser or use a command-line tool like curl to access the dockerized page tracker:
You’ll see the expected error message due to a failed Redis connection, but at least you can access your Flask application running in a Docker container. To fix the error, you’ll need to specify the correct Redis URL through an environment variable that you’ll pass to the web-service container.
Stop that container now by hitting Ctrl+C or Cmd+C on your keyboard. Then, find the container’s identifier and remove the associated container:
$ docker ps -a
CONTAINER ID   IMAGE                     COMMAND                  CREATED
dd446a1b72a7   realpython/page-tracker   "flask --app page_tr…"   1 minute ago

$ docker rm dd446a1b72a7
The -a flag ensures that all containers are displayed, including the stopped ones. Otherwise, you wouldn’t see yours.
The proper way to connect your Flask web application to Redis through Docker is by creating a dedicated virtual network. First, list the available networks to check if you’ve already created page-tracker-network:
$ docker network ls
NETWORK ID     NAME                   DRIVER    SCOPE
46e9ff2ec568   bridge                 bridge    local
4795b850cb58   host                   host      local
f8f99d305c5e   none                   null      local
84b134794660   page-tracker-network   bridge    local
If it’s not there, then you can create one now by issuing the following command:
$ docker network create page-tracker-network
In a similar fashion, you can create a volume for the Redis server to store its data persistently on your host machine. That way, you can restart or even remove and create a new container from scratch, and Redis will have access to its previous state. This is how you can create a named volume with Docker:
$ docker volume create redis-volume
Next, stop and remove any Redis container that may be hanging around, and launch a new one. This time, you’ll connect the container to the page-tracker-network and bind its /data folder to the volume named redis-volume that you just created:
$ docker run -d \
             -v redis-volume:/data \
             --network page-tracker-network \
             --name redis-service \
             redis:7.0.10-bullseye
When you look at the official Docker image of Redis on GitHub, then you’ll see a layer that defines a mount point at the /data folder. Redis will dump its state into that folder from time to time. By mounting a directory from your host to this mount point, you’ll be able to persist the state even when the container is restarted.
By giving your container a descriptive name, redis-service, you’ll be able to connect to it from another container on the same network. Here’s how:
$ docker run -d \
             -p 80:5000 \
             -e REDIS_URL=redis://redis-service:6379 \
             --network page-tracker-network \
             --name web-service \
             realpython/page-tracker
You start a new container derived from the page-tracker image with a fair number of parameters. Here’s a quick breakdown of the individual flags and options in the docker run command above:
-d: Run the container in the background, detached from the terminal. This means that you won’t see any output from the Flask server, and you won’t be able to stop the container with Ctrl+C or Cmd+C anymore.-p 80:5000: Expose the container’s port5000on port80of the host machine so that you can access your web application through localhost.-e REDIS_URL=...: Set the container’s environment variable with the address of a Redis server running in another container on the same network.--network page-tracker-network: Specify a virtual network for the container to use. This will allow other containers on the same network to communicate with this container through abstract names rather than IP addresses.--name web-service: Assign a meaningful name to the container, making it easier to reference the container from Docker commands.
Now, when you access your Flask web application, in either your web browser or the terminal, you should observe the correct behavior:
Every time you send a request, the server responds with a different number of page views. Note that you’re accessing the server through localhost. If you started redis-service before web-service, then the container’s IP address has likely changed.
Whew! That was a lot of work just to get two services up and running. As you can see, managing Docker images, containers, volumes, networks, ports, and environment variables can feel overwhelming when done by hand. And this is just scratching the surface! Imagine the effort required to manage a complex application with dozens of services with production-ready monitoring, load balancing, auto-scaling, and more.
Fortunately, there’s a better way to achieve the same effect. In the next section, you’ll look into a convenient abstraction layer on top of Docker, letting you orchestrate both services with a single command before you define your continuous integration pipeline.
Orchestrate Containers Using Docker Compose
Most real-world applications consist of multiple components, which naturally translate into Docker containers. For example, a somewhat more involved web application could have the following:
- Back end: Django, FastAPI, Flask
- Front end: Angular, React, Vue
- Cache: Couchbase, Memcached, Redis
- Queue: ActiveMQ, Kafka, RabbitMQ
- Database: MySQL, PostgreSQL, SQLite
Bigger applications may choose to subdivide their back-end or front-end components into even more microservices responsible for things like authentication, user management, order processing, payments, or messaging, to name a few.
To help manage and, to some extent, orchestrate multiple Docker containers for such applications, you can use Docker Compose. It’s a tool that works on top of Docker and simplifies running multi-container Docker applications. Docker Compose lets you define your application in terms of interdependent services along with their configuration and requirements. It’ll then coordinate them and run them as one coherent application.
Note: Container orchestration automates deployments, scaling, and configuration management of a distributed application. While Docker Compose can help with a rudimentary form of orchestration, you’re better off using tools like Kubernetes in more complex, large-scale systems.
You’ll use Docker Compose to declaratively describe your multi-container page tracker application, along with its services, networks, and volumes, using a single configuration file. By doing so, you’ll be able to track changes and deploy your application to any environment. Before diving in, though, make sure that you have Docker Compose installed on your computer.
Set Up Docker Compose on Your Computer
If you followed the instructions on setting up Docker Desktop, then you should already have Docker Compose installed. Run the following command in your terminal to confirm this:
$ docker compose version
Docker Compose version v2.17.2
Using Docker Desktop, which bundles Docker Compose and a few other components, is currently the recommended way of getting Docker Compose on macOS and Windows. If you’re on Linux, then you may try an alternative path by installing the Compose plugin manually or from your distribution’s package repository. Unfortunately, this method might not work with the latest and recommended version of Docker Compose.
Note: In the old days, Docker Compose was an independent project maintained separately from Docker. It was initially implemented as a Python script that eventually got rewritten into Go.
To use Docker Compose, you had to call the docker-compose (with a hyphen) executable in the command line. However, it’s now integrated into the Docker platform, so you can invoke Docker Compose as the docker compose plugin. Both commands should work the same, as the plugin is meant to be a drop-in replacement.
Once you’ve confirmed that Docker Compose is available in your terminal, you’re ready to go!
Define a Multi-Container Docker Application
Because you’ll be defining a multi-container Docker application that could potentially grow to include many more services in the future, it’s worthwhile to rearrange the folder structure in your project. Create a new subfolder named web/ in your project root folder, where you’ll store all the files related to the Flask web service.
Your virtual environment also belongs to this new subfolder because other services might be implemented in a completely foreign programming language like C++ or Java. Unfortunately, moving the venv/ folder would likely break the absolute paths hard-coded in the corresponding activation scripts. Therefore, remove the old virtual environment and create a new one in the web/ subfolder to be safe:
Then, move the Flask application to the new web/ subfolder, leaving behind only the .git/ folder, .gitignore, and any other editor-related configuration files. You can keep these in the project root folder because they’re common to all possible services in your project. Afterward, your project structure should look like this:
page-tracker/
│
├── web/
│   │
│   ├── src/
│   │   └── page_tracker/
│   │       ├── __init__.py
│   │       └── app.py
│   │
│   ├── test/
│   │   ├── e2e/
│   │   │   └── test_app_redis_http.py
│   │   │
│   │   ├── integration/
│   │   │   └── test_app_redis.py
│   │   │
│   │   ├── unit/
│   │   │   └── test_app.py
│   │   │
│   │   └── conftest.py
│   │
│   ├── venv/
│   │
│   ├── constraints.txt
│   ├── Dockerfile
│   ├── Dockerfile.dev
│   └── pyproject.toml
│
├── .git/
│
├── .gitignore
└── docker-compose.yml
One new addition to the file tree above is the docker-compose.yml file located at the top level, which you’ll be writing now.
Docker Compose uses the YAML format to declaratively describe your application’s services, which will become Docker containers, their networks, volumes, port mappings, environment variables, and more. Previously, you had to painstakingly define each piece of your application’s architecture by hand, but with Docker Compose, you can define it all in one file. The tool can even pull or build images for you!
Note: If you’ve never used YAML before, but you’re familiar with JSON, then its syntax should feel familiar, as YAML is a superset of JSON. Check out YAML: The Missing Battery in Python for more details.
The Docker Compose file is where you’ll define your services, networks, and volumes. Here’s the complete docker-compose.yml file, which reflects everything that you’ve defined for your page tracker application manually in earlier sections:
 1# docker-compose.yml
 2
 3services:
 4  redis-service:
 5    image: "redis:7.0.10-bullseye"
 6    networks:
 7      - backend-network
 8    volumes:
 9      - "redis-volume:/data"
10  web-service:
11    build: ./web
12    ports:
13      - "80:5000"
14    environment:
15      REDIS_URL: "redis://redis-service:6379"
16    networks:
17      - backend-network
18    depends_on:
19      - redis-service
20
21networks:
22    backend-network:
23
24volumes:
25  redis-volume:
You’re going to dissect it line by line now:
- Line 3 marks the beginning of a declaration of your two services,
redis-serviceandweb-service, comprising a multi-container Docker application. Note that you can scale up each service, so the actual number of Docker containers may be greater than the number of services declared here. - Lines 4 to 9 define configuration for
redis-service, including the Docker image to run, the network to connect to, and the volume to mount. - Lines 10 to 19 configure
web-serviceby specifying the folder with a Dockerfile to build, the ports to expose, the environment variables to set, and the networks to connect to. Thedepends_onstatement requiresredis-serviceto be available beforeweb-servicecan start. - Lines 21 and 22 define a virtual network for your two services. This declaration isn’t strictly necessary, as Docker Compose would automatically create and hook up your containers to a new network. However, an explicit network declaration gives you more control over its settings and its address range, if you need one.
- Lines 24 and 25 define a persistent volume for your Redis server.
Some values in the configuration file above are quoted, while others aren’t. This is a precaution against a known quirk in the older YAML format specification, which treats certain characters as special if they appear in unquoted strings. For example, the colon (:) can make some YAML parsers interpret the literal as a sexagesimal number instead of a string.
Note: This file adheres to the most current and recommended Compose specification, which no longer requires a top-level version field, whereas earlier schema versions did. Read about Compose file versioning in the official documentation to learn more.
Stop any Docker containers related to your project that might still be running, and remove their associated resources now:
$ docker stop -t 0 web-service redis-service
$ docker container rm web-service redis-service
$ docker network rm page-tracker-network
$ docker volume rm redis-volume
This will remove your two containers, a network, and a volume that you created earlier. Note that you can abbreviate the docker container rm command to a shorter docker rm alias.
To remove a container gracefully, you should first stop it. By default, the docker stop command will wait ten seconds before killing the container, giving it plenty of time to perform any necessary cleanup actions before exiting. Because your Flask application doesn’t need to do anything after it stops running, you can set this timeout to zero seconds using the -t option, which will terminate the listed containers immediately.
To remove all the associated Docker image tags, you must first find their common identifier:
$ docker images
REPOSITORY                TAG              IMAGE ID       CREATED      SIZE
page-tracker              dde1dc9          9cb2e3233522   1 hour ago   204MB
page-tracker              latest           9cb2e3233522   1 hour ago   204MB
realpython/page-tracker   dde1dc9          9cb2e3233522   1 hour ago   204MB
realpython/page-tracker   latest           9cb2e3233522   1 hour ago   204MB
(...)
In this case, the short ID common to all tags of the page-tracker image is equal to 9cb2e3233522, which you can use to untag and remove the underlying Docker image:
$ docker rmi -f 9cb2e3233522
Untagged: page-tracker:dde1dc9
Untagged: page-tracker:latest
Untagged: realpython/page-tracker:dde1dc9
Untagged: realpython/page-tracker:latest
Deleted: sha256:9cb2e3233522e020c366880867980232d747c4c99a1f60a61b9bece40...
The docker rmi command is an alias of docker image rm and docker image remove.
Note: If you’d like to start from scratch with a fresh Docker environment, and you don’t mind losing data, then you can prune all the system resources with the following command:
$ docker system prune --all --volumes
Warning! This will remove everything you’ve created with Docker up to this point, including resources that could’ve been created outside of this tutorial, so proceed with caution.
After confirming the removal of your Docker resources, you can bring back your page tracker application in a heartbeat with a single instruction. Issue the following command in the same folder as your docker-comopse.yml file to avoid specifying its path:
$ docker compose up -d
(...)
[+] Running 4/4
 ⠿ Network page-tracker_backend-network    Created                      0.1s
 ⠿ Volume "page-tracker_redis-volume"      Created                      0.0s
 ⠿ Container page-tracker-redis-service-1  Started                      1.0s
 ⠿ Container page-tracker-web-service-1    Started                      1.3s
The first time you run this command, it may take longer because Docker Compose has to download the Redis image from Docker Hub and build another image from your Dockerfile again. But after that, it should feel almost instantaneous.
You can see in the output above that Docker Compose created the requested network, volume, and two containers. Note that it always prefixes such resource names with your Docker Compose project name, which defaults to the folder name containing your docker-compose.yml file. In this case, the project name is page-tracker. This feature helps prevent resource names of different Docker Compose projects from clashing.
Additionally, Docker Compose appends consecutive numbers to your container names in case you want to launch multiple replicas of the same service.
The Docker Compose plugin provides several useful commands for managing your multi-container application. Here are just a few of them:
$ docker compose ps
NAME                           COMMAND                  SERVICE        ...
page-tracker-redis-service-1   "docker-entrypoint.s…"   redis-service  ...
page-tracker-web-service-1     "flask --app page_tr…"   web-service    ...

$ docker compose logs --follow
(...)
page-tracker-web-service-1    |  * Running on all addresses (0.0.0.0)
page-tracker-web-service-1    |  * Running on http://127.0.0.1:5000
page-tracker-web-service-1    |  * Running on http://172.20.0.3:5000
page-tracker-web-service-1    | Press CTRL+C to quit

$ docker compose stop
[+] Running 2/2
 ⠿ Container page-tracker-web-service-1    Stopped                     10.3s
 ⠿ Container page-tracker-redis-service-1  Stopped                      0.4s

$ docker compose restart
[+] Running 2/2
 ⠿ Container page-tracker-redis-service-1  Started                      0.4s
 ⠿ Container page-tracker-web-service-1    Started                      0.5s

$ docker compose down --volumes
[+] Running 4/4
 ⠿ Container page-tracker-web-service-1    Removed                      6.0s
 ⠿ Container page-tracker-redis-service-1  Removed                      0.4s
 ⠿ Volume page-tracker_redis-volume        Removed                      0.0s
 ⠿ Network page-tracker_backend-network    Removed                      0.1s
For example, you can list the containers within your Docker Compose project without showing any other containers. Using a relevant command, you can view their live output, stop, start, and restart them all. When you’re done with your project, you can tear it down, and Docker Compose will remove the associated containers and networks. It won’t touch the persistent data storage, though, unless you explicitly request that with the --volumes flag.
One thing that you may have noticed in the logs, which Flask has been complaining about for a long time now, is the use of its insecure, inefficient, and unstable development web server to run your application. You’ll use Docker Compose to fix that now.
Replace Flask’s Development Web Server With Gunicorn
Docker lets you override the default command or entry point listed in a Dockerfile when you run a new container. For example, the default command in the redis image starts the Redis server. However, you used that same image before to start redis-cli in another container. Similarly, you can specify a custom command for your Docker images in the docker-compose.yml file. You’ll use this feature to run Flask through a production-grade web server.
Note: Sometimes, you want to investigate an existing container. To run a command in a running container instead of starting up a new one, you can use the docker exec command:
$ docker exec -it -u root page-tracker-web-service-1 /bin/bash
root@6e23f154a5b9:/home/realpython#
By running the Bash executable, /bin/bash, and specifying a user with the -u option, you effectively access the container as if logging into a remote server over SSH. The -it flags are required to run an interactive terminal session. Otherwise, the command would exit immediately.
There are a few options for replacing Flask’s built-in development web server, which the official documentation recommends when deploying to production. One of the most popular choices is Gunicorn (Green Unicorn), which is a pure-Python implementation of the Web Server Gateway Interface (WSGI) protocol. To start using it, you must add the gunicorn package as another dependency in your project:
# web/pyproject.toml

[build-system]
requires = ["setuptools>=67.0.0", "wheel"]
build-backend = "setuptools.build_meta"

[project]
name = "page-tracker"
version = "1.0.0"
dependencies = [
    "Flask",
    "gunicorn",
    "redis",
]

[project.optional-dependencies]
dev = [
    "bandit",
    "black",
    "flake8",
    "isort",
    "pylint",
    "pytest",
    "pytest-timeout",
    "requests",
]
Notice that you add gunicorn to the list of regular dependencies because it’s going to become an integral part of your application. You want it to be available after you’ve built the final Docker image.
As usual, reinstall your page-tracker package locally and pin its dependencies in the constraints file. Keep in mind that you may need to activate your virtual environment first since you re-created it in the web/ subfolder earlier:
(page-tracker) $ python -m pip install --editable "web/[dev]"
(page-tracker) $ python -m pip freeze --exclude-editable > web/constraints.txt
Note that these commands will look slightly different when you execute them from your project’s root folder. In such a case, you must replace the dot (.), which indicates the current working directory, with a path to your web/ subfolder.
Now that you’ve installed Gunicorn, you can start using it. Modify docker-compose.yml by adding a new command attribute under your web-service key:
# docker-compose.yml

services:
  redis-service:
    image: "redis:7.0.10-bullseye"
    networks:
      - backend-network
    volumes:
      - "redis-volume:/data"
  web-service:
    build: ./web
    ports:
      - "80:8000"
    environment:
      REDIS_URL: "redis://redis-service:6379"
    networks:
      - backend-network
    depends_on:
      - redis-service
    command: "gunicorn page_tracker.app:app --bind 0.0.0.0:8000"

networks:
    backend-network:

volumes:
  redis-volume:
This command will take precedence over your Dockerfile’s default command, which relies on Flask’s development server. From now on, Docker Compose will run your web application with Gunicorn instead. To show the difference, you’ll run the server on port 8000 instead of 5000, so you also change the port mapping.
By exposing port 80 on the host machine, you’ll still be able to access the application at http://localhost without specifying the port number.
Don’t forget to commit your changes to save your work in a local Git repository:
$ git add .
$ git commit -m "Refactor folders and add Docker Compose"
It’s always a good idea to make small and frequent commits so that you can track incremental changes over time and have a better history of your work. If you’re unsure how to describe your commit, then try to explain why you made a certain change, as Git already keeps track of what has changed.
Okay. If you now tried restarting your Docker Compose application, then it’d fail because Docker wouldn’t find the requested gunicorn executable during container startup. You’ve added an extra dependency that’s missing from the Docker image that you built earlier. Therefore, you have to tell Docker Compose to rebuild your image. You can do so with either of the following commands:
docker compose builddocker compose up --build
In the first case, you’d explicitly tell Docker to build the image up front. Whenever you change your project dependencies or the Dockerfile, you’d then have to run docker compose build again to apply these changes.
In the second case, docker compose up --build will instruct Docker to build the image on the fly each time you start the containers. This is especially useful if you’re trying to quickly iterate over changes to the source code or the Dockerfile.
Either way, both commands should successfully build the modified layers in any affected Docker images before starting their corresponding containers. Then, you can rest assured that all dependencies will be available by the time your Docker Compose application starts again. Go ahead and run one of these commands now.
Because you understand how to use Docker Compose to manage your application’s services, you can now look at how to run end-to-end tests in an environment approximating production.
Run End-to-End Tests Against the Services
In the first attempt, you’ll execute your end-to-end tests locally from your host machine. Note that all the necessary services must be accessible from your local network for this to work. While this isn’t ideal because you don’t want to expose any sensitive services like a database to the public, you’ll learn about a better way in a bit. In the meantime, you can update your docker-compose.yml configuration to forward the Redis port:
# docker-compose.yml

services:
  redis-service:
    image: "redis:7.0.10-bullseye"
    ports:
      - "6379:6379"
    networks:
      - backend-network
    volumes:
      - "redis-volume:/data"
  web-service:
    build: ./web
    ports:
      - "80:8000"
    environment:
      REDIS_URL: "redis://redis-service:6379"
    networks:
      - backend-network
    depends_on:
      - redis-service
    command: "gunicorn page_tracker.app:app --bind 0.0.0.0:8000"

networks:
    backend-network:

volumes:
  redis-volume:
If you have an existing Docker container for redis-service, then you’ll need to remove that container first, even if it’s currently stopped, to reflect the new port forwarding rules. Fortunately, Docker Compose will automatically detect changes in your docker-compose.yml file and re-create your containers as needed when you issue the docker compose up command:
$ docker compose up -d
[+] Running 2/2
 ⠿ Container page-tracker-redis-service-1  Started                      1.0s
 ⠿ Container page-tracker-web-service-1    Started                      1.2s

$ docker compose ps
NAME                           ...   PORTS
page-tracker-redis-service-1   ...   0.0.0.0:6379->6379/tcp
page-tracker-web-service-1     ...   0.0.0.0:80->8000/tcp
After listing your new containers, you should see that port 6379 on the Redis container is being forwarded to the host machine. With this, you can now run your end-to-end tests using pytest installed in a virtual environment on your development machine:
(page-tracker) $ python -m pytest web/test/e2e/ \
  --flask-url http://localhost \
  --redis-url redis://localhost:6379
Thanks to the port mapping, you can use localhost to connect to the containers without knowing their individual IP addresses.
Note: If your test succeeds, then it’ll overwrite the number of page views in Redis. As a rule of thumb, you should never run tests on a live environment with customer data to avoid disrupting it. It’s generally recommended to use a staging or certification environment with fake or anonymized data to perform comprehensive end-to-end testing safely.
To simulate a failure, you can temporarily pause your containers for the duration of test execution:
$ docker compose pause
[+] Running 2/0
 ⠿ Container page-tracker-web-service-1    Paused                       0.0s
 ⠿ Container page-tracker-redis-service-1  Paused                       0.0s
This will make both Redis and your Flask application no longer accessible. Unlike stopping a container, pausing it doesn’t terminate the underlying process, so pausing keeps the container’s state and results in a faster resumption.
Don’t forget to unpause your containers afterward to avoid errors later on:
$ docker compose unpause
[+] Running 2/0
 ⠿ Container page-tracker-web-service-1    Unpaused                     0.0s
 ⠿ Container page-tracker-redis-service-1  Unpaused                     0.0s
Alternatively, instead of running the end-to-end test locally against publicly exposed services, you can run it from another container on the same network. You could craft such a container manually. However, recent versions of Docker Compose provide a more elegant solution, which lets you run subsets of services conditionally. You do this by assigning the desired services to custom profiles that you can activate on demand.
First, open your docker-compose.yml file and remove port forwarding from Redis, as you don’t want to expose it to the outside world anymore. Then, add a new service based on your old Dockerfile.dev, which bundles the testing framework, test fixtures, and your test code. You’ll use the corresponding Docker image to execute your end-to-end test:
 1# docker-compose.yml
 2
 3services:
 4  redis-service:
 5    image: "redis:7.0.10-bullseye"
 6    networks:
 7      - backend-network
 8    volumes:
 9      - "redis-volume:/data"
10  web-service:
11    build: ./web
12    ports:
13      - "80:8000"
14    environment:
15      REDIS_URL: "redis://redis-service:6379"
16    networks:
17      - backend-network
18    depends_on:
19      - redis-service
20    command: "gunicorn page_tracker.app:app --bind 0.0.0.0:8000"
21  test-service:
22    profiles:
23      - testing
24    build:
25      context: ./web
26      dockerfile: Dockerfile.dev
27    environment:
28      REDIS_URL: "redis://redis-service:6379"
29      FLASK_URL: "http://web-service:8000"
30    networks:
31      - backend-network
32    depends_on:
33      - redis-service
34      - web-service
35    command: >
36      sh -c 'python -m pytest test/e2e/ -vv
37      --redis-url $$REDIS_URL
38      --flask-url $$FLASK_URL'
39
40networks:
41    backend-network:
42
43volumes:
44  redis-volume:
Most of the docker-compose.yml file remains unchanged, so you can focus your attention on the highlighted lines:
- Line 22 defines a list of profiles that your new service will belong to. There’s only going to be one profile, called
testing, which you’ll enable to run the tests. - Lines 24 to 26 specify the path to a directory containing your Dockerfile to build. Since the file has a non-standard name, you provide it explicitly.
- Lines 27 to 29 define two environment variables, which your test will use to connect to Redis and Flask running behind the Gunicorn server. Note that you use Docker Compose service names as host names.
- Lines 30 and 31 connects the service to the same network as the other two services.
- Lines 32 to 34 ensure that Redis and Flask start before the end-to-end test.
- Lines 35 to 38 define the command to run when your service starts. Note that you use YAML’s multiline literal folding (
>) to format the long shell command in a more readable way.
Because Docker Compose has access to your host machine’s shell, it’ll try to interpolate any reference to an environment variable, such as $REDIS_URL or $FLASK_URL, that appears in your docker-compose.yml as soon as the file is parsed. Unfortunately, these variables most likely aren’t defined yet. You specify them through the environment section of your service, which means that your container will get these variables later.
To disable premature substitution of environment variables by Docker Compose, you escape the dollar sign with two dollar signs ($$). This, in turn, produces the literal strings $REDIS_URL and $FLASK_URL in the command that will be executed in the resulting container. To interpolate those variables when the container starts, you must wrap the entire command in single quotes (') and pass it to the shell (sh).
When you start a multi-container application with Docker Compose, only the core services that don’t belong to any profile start. If you also wish to start the services that were assigned to one or more profiles, then you must list those profiles using the --profile option:
$ docker compose --profile testing up -d
[+] Running 3/3
 ⠿ Container page-tracker-redis-service-1  Running                      0.0s
 ⠿ Container page-tracker-web-service-1    Running                      0.0s
 ⠿ Container page-tracker-test-service-1   Started                      0.6s

$ docker compose ps -a
NAME                           ...   SERVICE             STATUS       ...
page-tracker-redis-service-1   ...   redis-service       running      ...
page-tracker-test-service-1    ...   test-service        exited (0)   ...
page-tracker-web-service-1     ...   web-service         running      ...
Note that this is an option of the docker compose command rather than its up subcommand, so watch out for the argument order. The output shows an extra service that started, but when you investigate it, you’ll notice that the test-service quickly exits with a successful status zero.
To reveal more information about this service, you can view its logs:
$ docker compose logs test-service
============================= test session starts ==========================
platform linux -- Python 3.11.2, pytest-7.2.2, pluggy-1.0.0 -- /home/realp..
cachedir: .pytest_cache
rootdir: /home/realpython
plugins: timeout-2.1.0
collecting ... collected 1 item

test/e2e/test_app_redis_http.py::test_should_update_redis ... PASSED [100%]

============================== 1 passed in 0.10s ===========================
This will show you detailed information about the service, including the test result in the form of a pytest report, as well as any errors that may have occurred. In this case, the test passed successfully. Note that the output above has been edited for brevity.
By now, you have your source code under version control using Git. You automated various levels of tests and built your application with Docker. Finally, you orchestrated multiple containers using Docker Compose. At this point, you’re ready to move on to the next step, which is building a continuous integration pipeline with Docker.
Define a Docker-Based Continuous Integration Pipeline
The goal of continuous integration (CI) is to allow for faster and more predictable software releases by integrating code changes from multiple developers on the team as often as possible. Back in the day, integration was a significant undertaking that often took weeks or even months to complete, sometimes involving a dedicated team of integration engineers.
The problem with this approach is that everyone on the team works on their own copy of the project. The longer the integration phase is delayed, the more likely it is that the different versions of the project will diverge, making it difficult to combine them. In some cases, integration could take more time than the actual development of the project!
The word continuous implies that integration should be frequent to minimize the scope of changes and reduce the risk of introducing defects into the codebase. It’s become standard practice for teams to integrate the individual developers’ work at least once a day or preferably multiple times a day.
To make this possible, continuous integration requires build and test automation as well as short-lived code branches with relatively small features to implement. Feature toggles can help with bigger features that would take longer to develop. Moreover, fixing a failed build after an unsuccessful attempt to integrate changes should be a priority for the team in order to keep the process truly continuous.
To introduce continuous integration in your project, you need the following elements:
- Version control system
- Branching strategy
- Build automation
- Test automation
- Continuous integration server
- Frequent integrations
A version control system like Git allows multiple people to work on the same piece of code simultaneously. Depending on your team structure, experience, and other factors, you can choose from different source control branching models, also known as workflows. Some of the most popular ones include:
Each has its pros and cons and can be applied to different scenarios. For example, the forking strategy works well in open-source projects because it allows anyone to contribute without special permission. In this tutorial, you’ll use the popular feature branch workflow known as the GitHub Flow. It only has one long-lived mainline, or trunk, traditionally called the master branch, from which you branch off several short-lived feature branches.
Note: Despite a long-standing tradition of using the term master to refer to the main branch, GitHub recently announced that it’d be changing its default branch name to main to reflect its purpose better and avoid offensive language.
At the same time, Git continues to use master when you initialize a new repository, which can occasionally become problematic when you’re trying to synchronize local and remote repositories. Therefore, you’ll stick to using master in this tutorial to keep things simple, but feel free to take the extra steps if you’d like to change the default branch name. You can tweak the default branch name in your GitHub repository settings.
While you’ll find several different approaches to achieving continuous integration with GitHub Flow, these are the steps that you’ll follow for your Docker application:
- Fetch the latest version of the mainline to your computer.
- Create a feature branch from the mainline.
- Open a pull request to get early feedback from others.
- Keep working on your feature branch.
- Fetch the mainline often, merging it into your feature branch and resolving any potential conflicts locally.
- Build, lint, and test the code on your local branch.
- Push your changes whenever the local build and tests succeed.
- With each push, check the automated tests that run on the CI server against your feature branch.
- Reproduce and fix any identified problems locally before pushing the code again.
- Once you’re done, and all tests pass, request that one or more coworkers review your changes.
- Apply their feedback until the reviewers approve your updates and all tests pass on the CI server after pushing your latest changes.
- Close the pull request by merging the feature branch to the mainline.
- Check the automated tests running on the CI server against the mainline with the changes from your feature branch integrated.
- Investigate and fix any issues that may be found, for example, due to new updates introduced to the mainline by others between your last push and merging.
This list is quite comprehensive, but there’s no single continuous integration process that works for everyone. You can be even more thorough than that by, for example, provisioning a dedicated staging environment with Terraform or GitHub Codespaces and deploying your feature branch to the cloud for additional manual testing before closing the pull request. However, spinning up a new environment for each pull request may not be cost-effective.
Note: Software engineering teams often combine continuous integration with continuous delivery to form a single process known as CI/CD. Continuous delivery is an extension of continuous integration that adds extra steps to deploy a verified and integrated build to the production environment.
While continuous delivery provides technical means for automatically deploying the build to production, it still requires a business decision and a manual trigger to pull.
Don’t confuse continuous delivery with continuous deployment, which is a fully automated process requiring no manual intervention to deploy an application to production. In continuous deployment, as soon as you push the code, it gets tested and integrated into the mainline, and then it ends up in the production environment. But, to succeed at this, you need extensive test coverage and trust in your automation process.
One important point worth emphasizing is the amount of testing involved. You should test your feature branch locally as well as on the continuous integration server and then run the tests again against the integrated mainline. This is to ensure that your feature works correctly and that it doesn’t break the mainline.
You have many options for setting up a continuous integration server for your Docker application, both online and self-hosted. Popular choices include CircleCI, Jenkins, and Travis. In this tutorial, you’ll use GitHub Actions, which is a free CI solution provided by GitHub.
Push Code to a GitHub Repository
To take advantage of GitHub Actions, you must first create a repository on GitHub. Sign up if you don’t already have an account, then sign in and create a new repository called page-tracker.
Public repositories can use GitHub Actions without limit, while private repositories receive two thousand minutes and five hundred megabytes of storage per month on the free tier. However, jobs running on Windows will consume twice as many minutes as on Linux, and macOS jobs will consume ten times as many minutes! You can find more details about billing for GitHub Actions in the official documentation.
Later, you’ll enable branch protection rules, which are currently only available for public repositories on the free tier, so it’s best to create a public repository now.
Keep the suggested defaults without initializing your new repository using GitHub’s placeholder files because you’ll be pushing an existing project. Next, head over to the terminal and change the working directory to where your page-tracker project lives. It should already have a local Git repository initialized, which you’ll connect to GitHub in a bit. But first, commit any pending changes to your local repository:
$ git status
On branch master
Changes not staged for commit:
  (use "git add <file>..." to update what will be committed)
  (use "git restore <file>..." to discard changes in working directory)
        modified:   docker-compose.yml

no changes added to commit (use "git add" and/or "git commit -a")

$ git commit -am "Add a test-service to Docker Compose"
It’s always a good idea to check the status of your repository before committing any changes. You can now connect your local repository to GitHub using the following two commands:
$ git remote add origin git@github.com:realpython/page-tracker.git
$ git push -u origin master
Make sure to replace realpython with your GitHub username. The first command will add a remote repository on GitHub, which you just created, to your local counterpart under the origin alias. The second command will push the contents of your local repository to GitHub.
You can refresh the web page with your GitHub repository afterward to confirm that your files have been sent successfully. When you do, you’ll be ready to build a continuous integration workflow for your Docker application with GitHub Actions!
Learn to Speak the GitHub Actions Lingo
First, it would help to familiarize yourself with a bit of new terminology. GitHub Actions let you specify one or more workflows triggered by certain events, like pushing code to a branch or opening a new pull request. Each workflow can define a number of jobs consisting of steps, which will execute on a runner. There are two type of runners:
- GitHub-Hosted Runners: Ubuntu Linux, Windows, macOS
- Self-Hosted Runners: On-premises servers that you own and maintain
You’re only going to use the latest Ubuntu Linux runner provided by GitHub in this tutorial. Note that it’s possible to execute the same job on multiple runners to, for example, check for cross-platform compatibility.
Unless you say otherwise, the jobs within one workflow will run on separate runners in parallel, which can be useful for speeding up builds. At the same time, you can make one job depend on other jobs. Another way to reduce the build time with GitHub Actions is to enable workflow dependency caching.
Each step of a job is implemented by an action that can be either:
- A custom shell command or a script
- A GitHub Action defined in another GitHub repository
There are many predefined GitHub Actions, which you can browse and find on the GitHub Marketplace. The community provides and maintains them. For example, there’s one for building and pushing Docker images owned by the Docker organization on GitHub. Because of many competing plugins, there’s sometimes more than one way to achieve the desired result using GitHub Actions.
As with many tools related to DevOps these days, GitHub uses the YAML format for configuring workflows. It looks for a special .github/workflows/ folder in your repository’s root folder, where you can put several YAML files, each corresponding to a different workflow. Additionally, you can include other files there, such as configuration files or custom scripts to execute on a runner.
You’ll only define one workflow for continuous integration, so go ahead and create the necessary folder structure with a file named ci.yml inside:
page-tracker/
│
├── web/
│
├── .git/
│
├── .github/
│   └── workflows/
│       └── ci.yml
│
├── .gitignore
└── docker-compose.yml
Although you can use whatever code editor you like to write a workflow file for GitHub Actions, consider using GitHub’s web-based editor in this case. Not only does it provide generic YAML syntax highlighting but also schema validation and intelligent suggestions for the available GitHub Actions attributes. Therefore, you may push your code to GitHub first and edit your ci.yml file directly there using the built-in editor.
To open the editor built into GitHub, navigate your web browser to the ci.yml file and hit E or click the pencil icon. You can now start writing your GitHub Actions workflow file.
Create a Workflow Using GitHub Actions
While you’re editing the ci.yml file, give your new workflow a descriptive name and define the events that should trigger it:
# .github/workflows/ci.yml

name: Continuous Integration

on:
  pull_request:
    branches:
      - master
  push:
    branches:
      - master
The two events that will trigger this workflow are:
- Opening or changing a pull request against the
masterbranch - Pushing code or merging a branch into the
masterbranch
Apart from the branch names, you can add a few more attributes to each event to narrow down the triggering conditions. For example, you may provide file path patterns acting as a positive filter that would only run the workflow when certain files were changed. After all, you may not want to run your entire continuous integration workflow after editing a README file or updating the documentation. Anyway, you’ll keep things simple for now.
Your continuous integration workflow’s job is to build a Docker image, run end-to-end tests with Docker Compose, and push the built image to Docker Hub if everything goes fine. Thanks to your comprehensive Dockerfile, unit tests, various static code analysis tools, and security scanning are integrated into one command. So, you don’t need to write a lot of YAML for your CI workflow.
Almost every job in a GitHub Action workflow starts by checking out the code from a GitHub repository:
# .github/workflows/ci.yml

name: Continuous Integration

on:
  pull_request:
    branches:
      - master
  push:
    branches:
      - master

jobs:
  build:
    name: Build Docker image and run end-to-end tests
    runs-on: ubuntu-latest
    steps:
      - name: Checkout code from GitHub
        uses: actions/checkout@v3
You specify a job identified as build that will run on the latest Ubuntu runner provided by GitHub. Its first step is to check out the single commit that triggered the workflow using the actions/checkout GitHub Action. Because GitHub Actions are really GitHub repositories in disguise, you can provide a Git tag or a commit hash after the at-sign (@) to choose a specific version of the action.
As the next step in your continuous integration pipeline, you want to build Docker images for your web and test services before executing the end-to-end tests through Docker Compose. Instead of using an existing action, you’ll run a shell command on the runner this time:
# .github/workflows/ci.yml

name: Continuous Integration

on:
  pull_request:
    branches:
      - master
  push:
    branches:
      - master

jobs:
  build:
    name: Build Docker image and run end-to-end tests
    runs-on: ubuntu-latest
    steps:
      - name: Checkout code from GitHub
        uses: actions/checkout@v3
      - name: Run end-to-end tests
        run: >
          docker compose --profile testing up
          --build
          --exit-code-from test-service
As with your docker-compose.yml file, you use YAML’s multiline literal folding (>) to break a long command into multiple lines for improved readability. You request that Docker Compose rebuild your images with the --build flag and stop all containers when the test-service terminates. Otherwise, your job could run indefinitely. This also returns the exit code of the test-service to the runner, potentially aborting subsequent steps.
These two steps will always run in response to the events listed at the top of the file, which is either opening a pull request or merging a feature branch into the mainline. Additionally, you’ll want to push your new Docker image to Docker Hub when all the tests pass after successfully merging a branch into the mainline. Therefore, you’ll run the next steps conditionally only when a push event triggers your workflow.
But how do you access Docker Hub securely without leaking your secrets using GitHub Actions? You’ll find out now.
Access Docker Hub Through GitHub Actions Secrets
Earlier, when you pushed one of your Docker images to a Docker Registry from the terminal, you had to log into Docker Hub by calling docker login and providing your username and password. Additionally, if you enabled two-factor authentication, then you had to generate a personal access token with sufficient permissions and provide it instead of your password.
The steps to push an image from an automated workflow are similar, so you’ll have to authenticate first. You can do so using a shell command or a predefined GitHub Action, such as docker/login-action:
# .github/workflows/ci.yml

name: Continuous Integration

on:
  pull_request:
    branches:
      - master
  push:
    branches:
      - master

jobs:
  build:
    name: Build Docker image and run end-to-end tests
    runs-on: ubuntu-latest
    steps:
      - name: Checkout code from GitHub
        uses: actions/checkout@v3
      - name: Run end-to-end tests
        run: >
          docker compose --profile testing up
          --build
          --exit-code-from test-service
      - name: Login to Docker Hub
        uses: docker/login-action@v2
        if: ${{ github.event_name == 'push' }}
        with:
          username: ${{ secrets.DOCKERHUB_USERNAME }}
          password: ${{ secrets.DOCKERHUB_TOKEN }}
You run this step conditionally by getting the event type from the github context using a JavaScript expression enclosed in a dollar sign followed by double curly brackets. Then, you provide your secret Docker Hub credentials through another predefined secrets context and two custom constants that you’re about to define now.
Open your GitHub repository’s Settings by clicking a tab with the gear icon in the toolbar at the top, find and expand Secrets and variables under the Security section, and then click Actions. This will take you to a panel that lets you define environment variables as well as encrypted secrets for your GitHub Actions runners. Now, specify your DOCKERHUB_USERNAME and DOCKERHUB_TOKEN secrets:
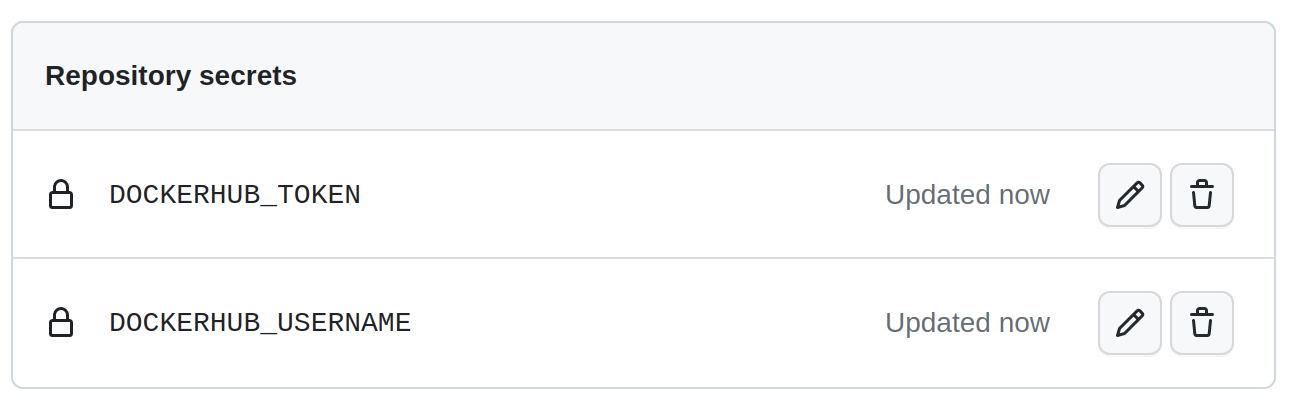
Note that these secrets are encrypted, and GitHub won’t show them to you again, so make sure that you save them somewhere safe. But, if you try hard enough, then you’ll be able to recover them—for instance, through a shell command in your workflow.
Once authenticated to Docker Hub, you can tag and push your new Docker image using another GitHub Action from the marketplace:
# .github/workflows/ci.yml

name: Continuous Integration

on:
  pull_request:
    branches:
      - master
  push:
    branches:
      - master

jobs:
  build:
    name: Build Docker image and run end-to-end tests
    runs-on: ubuntu-latest
    steps:
      - name: Checkout code from GitHub
        uses: actions/checkout@v3
      - name: Run end-to-end tests
        run: >
          docker compose --profile testing up
          --build
          --exit-code-from test-service
      - name: Login to Docker Hub
        uses: docker/login-action@v2
        if: ${{ github.event_name == 'push' }}
        with:
          username: ${{ secrets.DOCKERHUB_USERNAME }}
          password: ${{ secrets.DOCKERHUB_TOKEN }}
      - name: Push image to Docker Hub
        uses: docker/build-push-action@v4.0.0
        if: ${{ github.event_name == 'push' }}
        with:
          context: ./web
          push: true
          tags: |
            ${{ secrets.DOCKERHUB_USERNAME }}/page-tracker:${{ github.sha }}
            ${{ secrets.DOCKERHUB_USERNAME }}/page-tracker:latest
This action also runs conditionally when you merge a feature branch into the mainline. In the with section, you specify the path to your Dockerfile, request the action to push an image, and list the tags for your image. Notice that you use the github context again to obtain the current commit’s hash, albeit in the long form.
Note: GitHub Packages is another service integrated into GitHub. It can act as a replacement for Docker Hub. It supports various package types, including Docker images, letting you store your source code and binary packages in one place. The docker/build-push-action can leverage your GitHub token to push to GitHub Packages.
At this point, your continuous integration workflow is configured and ready to go. If you haven’t used the code editor built into GitHub, then remember to commit and push your local repository for the changes to take effect:
$ git status
On branch master
Untracked files:
  (use "git add <file>..." to include in what will be committed)
        .github/

nothing added to commit but untracked files present (use "git add" to track)

$ git add .github/
$ git commit -m "Add a continuous integration workflow"
$ git push
In the next section, you’ll enable a few branch protection rules to prevent anyone from pushing their code directly to the master branch. As a result, the push event in your workflow will only apply to merging a feature branch into the mainline through a pull request.
Enable Branch Protection Rules
Go to your repository’s Settings again, click Branches under the Code and automation section, and click the button labeled Add branch protection rule. Then, type the name of your mainline into the Branch name pattern field. If you followed the naming convention used in this tutorial, then you should type master into the input field:
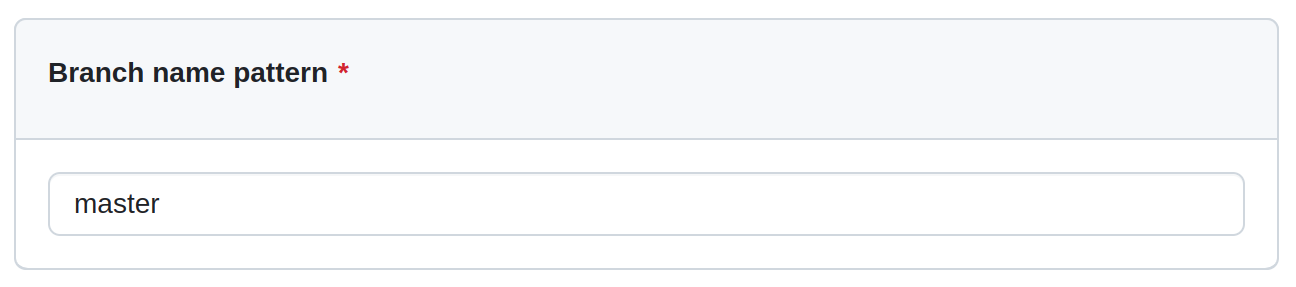
Next, enable an option just below that, which says Require a pull request before merging. This will automatically require approval from at least one reviewer. You can uncheck this option for now if you don’t have another account on GitHub. Otherwise, you won’t be able to merge your pull request without someone else approving it:
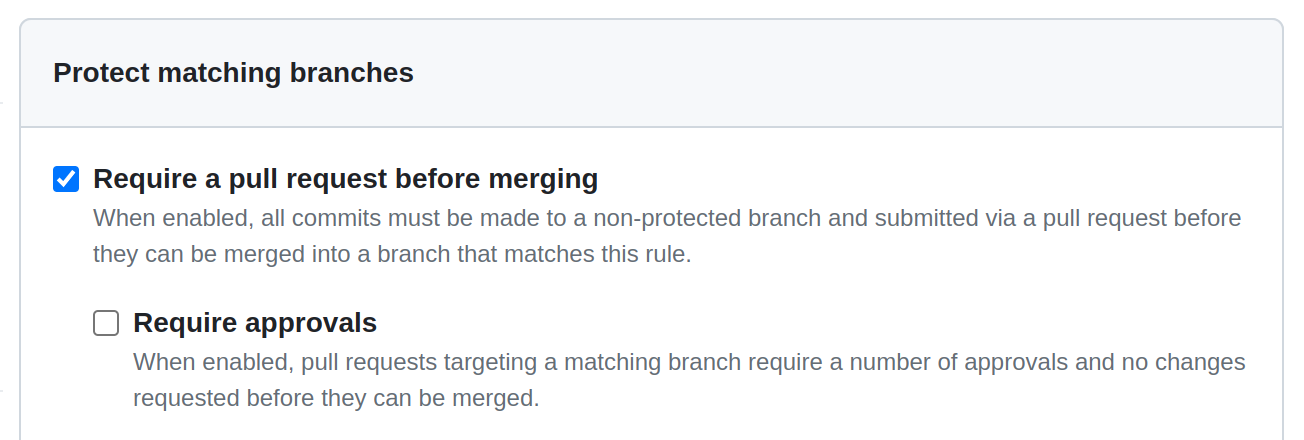
After scrolling down a bit, you’ll see an option that says Require status checks to pass before merging. Select it to reveal even more options. When you do, check another option to Require branches to be up to date before merging, which will prevent closing a pull request when your master branch has new commits. Finally, type the name of your job, build, into the search box below:
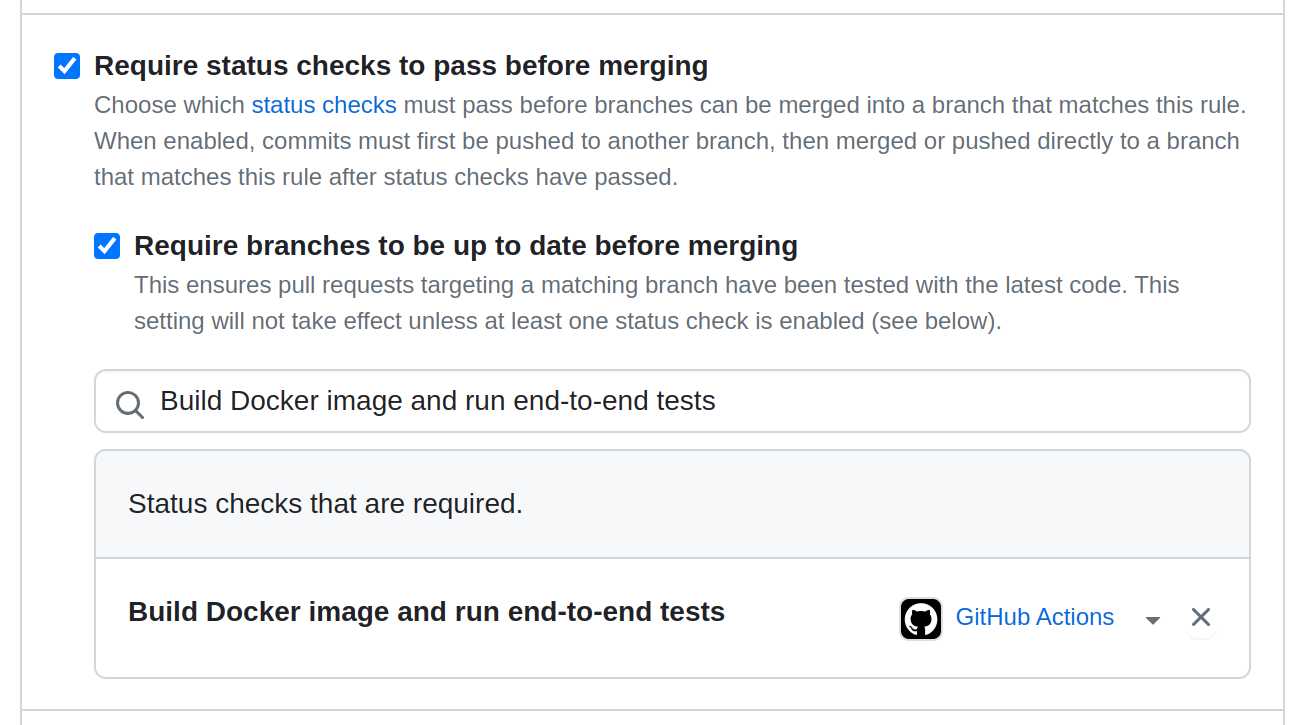
Now, each pull request will require your end-to-end tests to pass before merging is allowed.
To enforce these rules without allowing any bypasses for administrators and other users with elevated privileges, you can select an option at the bottom labeled Do not allow bypassing the above settings:

All right. You’re all set! How about taking your continuous integration workflow for a test drive with your Docker application?
Integrate Changes From a Feature Branch
Follow the Docker-based continuous integration pipeline outlined earlier in this tutorial. Start by creating a separate feature branch, modify the code in a way that breaks your tests, commit your changes, and push them to GitHub:
You create and switch to a new local branch called feature/replace-emoji-face and then change the emoji in your error message from pensive face to thinking face without updating the corresponding unit test. After committing and pushing the branch to GitHub, you can open a new pull request from your feature branch into master by following the link in the highlighted line. As soon as you do, your continuous integration workflow will kick in.
When the GitHub Actions runner finishes its job, you won’t be able to merge your branch due to failed checks:
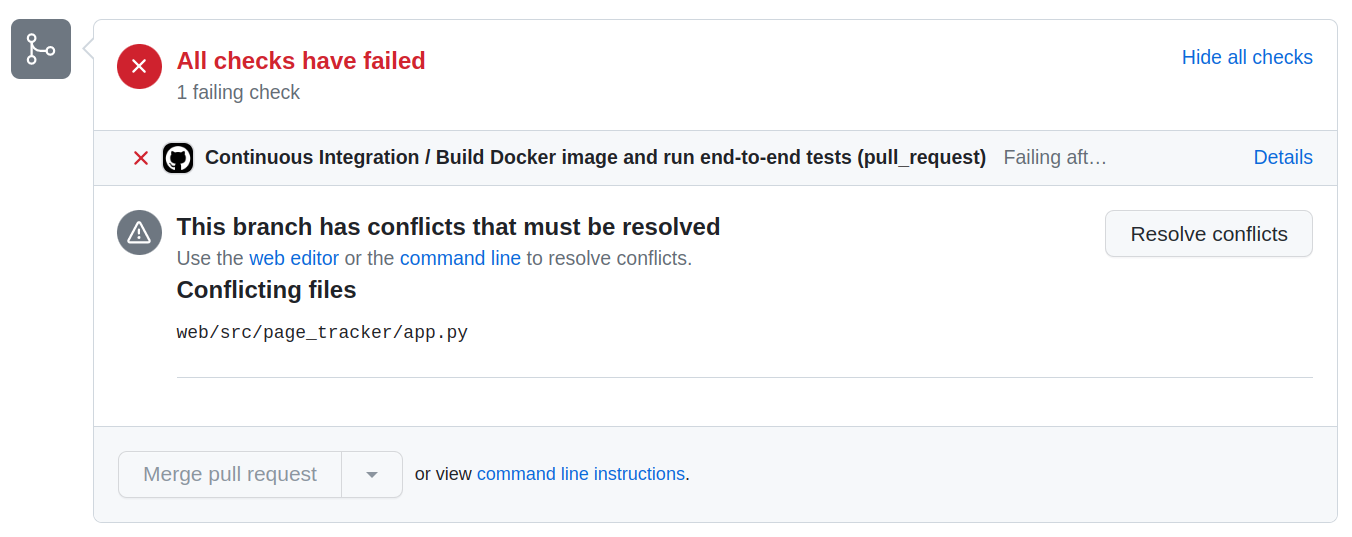
In this case, you have only one check corresponding to the build job in your workflow, which you configured as one of the branch protection rules in the previous section. You can click the Details link on the right to investigate the logs of a failed check, and you can optionally rerun the corresponding job in debug mode to collect even more data.
Additionally, the screenshot above depicts a hypothetical conflict between your feature branch and the target mainline. It indicates that someone else has modified the same file as you, and they successfully integrated their changes with the master branch while you were revamping emojis.
There’s no automatic way to resolve conflicts like this because it involves understanding the code’s logic and making subjective decisions about which changes to keep and which ones to discard. The only way to resolve this conflict is to merge the updated mainline into your local feature branch and manually integrate the conflicting changes.
Even without any conflict, if the mainline is a few commits ahead of your feature branch, then you’ll still have to merge the latest changes from master into your branch regardless of the test results. This is because of yet another branch protection rule that you put in place before:
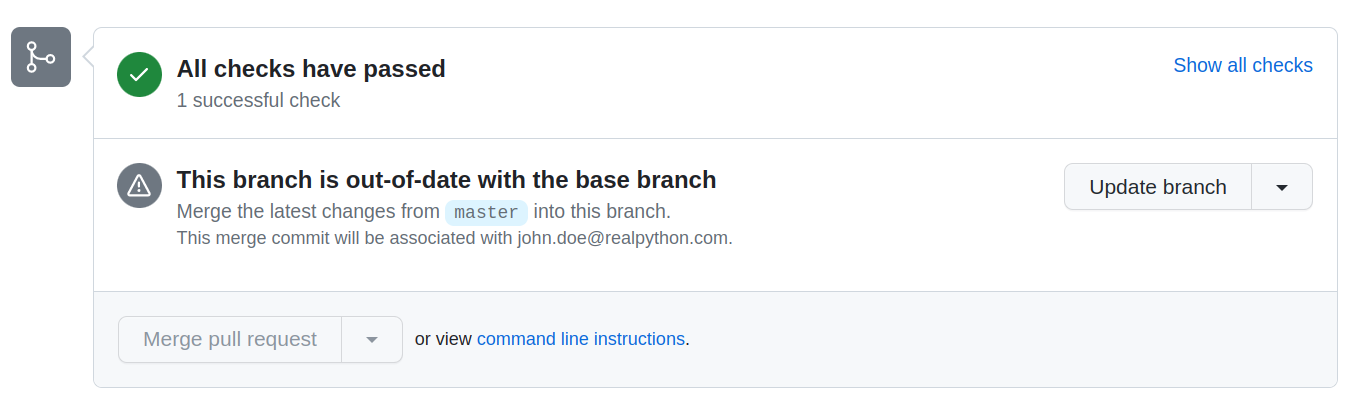
The Merge pull request button will remain grayed out and disabled until you take action to fix all of these problems.
In real life, you should now fetch the latest master and merge it to your feature branch, resolving any conflicts as necessary. Then, you’ll update the code to make all your tests pass again. Go back to your code editor and fix the failing unit test by using the expected emoji face:
 # web/test/unit/test_app.py

 # ...

 @unittest.mock.patch("page_tracker.app.redis")
 def test_should_handle_redis_connection_error(mock_redis, http_client):
     # Given
     mock_redis.return_value.incr.side_effect = ConnectionError

     # When
     response = http_client.get("/")

     # Then
     assert response.status_code == 500
-    assert response.text == "Sorry, something went wrong \N{pensive face}"
+    assert response.text == "Sorry, something went wrong \N{thinking face}"
Once you’ve run the tests locally and gained confidence in your code correctness, make another commit on the same branch and push it to GitHub. Before doing so, it’s worth double-checking the current branch:
$ git branch
* feature/replace-emoji-face
  master
$ git add web/test/unit/test_app.py
$ git commit -m "Fix the failing unit test"
$ git push
The pull request should pick up your change and start another CI build. Once all the protection rules get satisfied, you’ll be finally able to merge your feature branch into the protected mainline by clicking the green button:
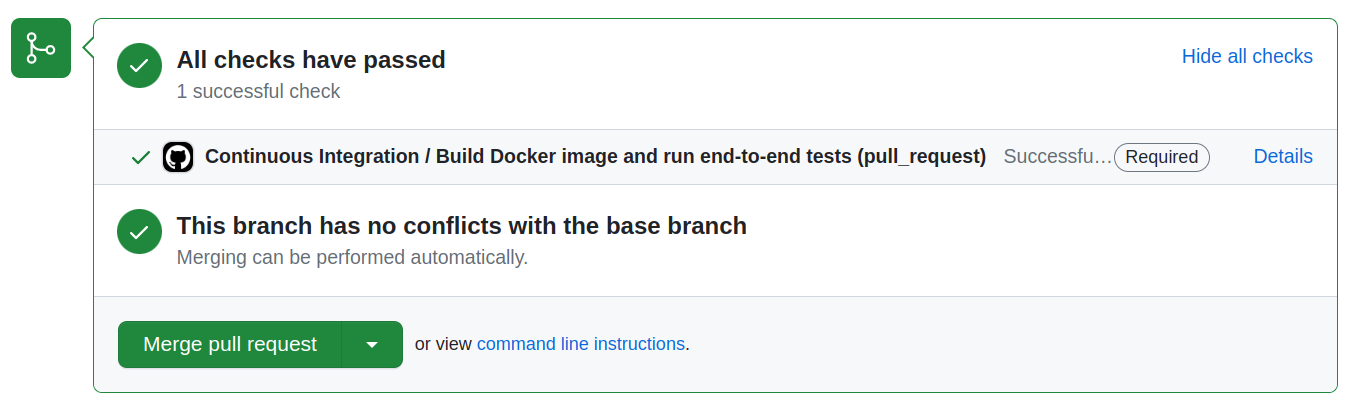
Depending on how you configure your repository, GitHub can offer to merge the pull request or squash the associated commits before merging the branch in order to maintain a linear commit history.
Note that merging will trigger yet another CI build against the master branch to test whether your changes integrate well with the rest of the codebase. There’s always a chance for something to go wrong. On the other hand, if the CI build succeeds, then the workflow will tag and push the image to your Docker Hub repository:
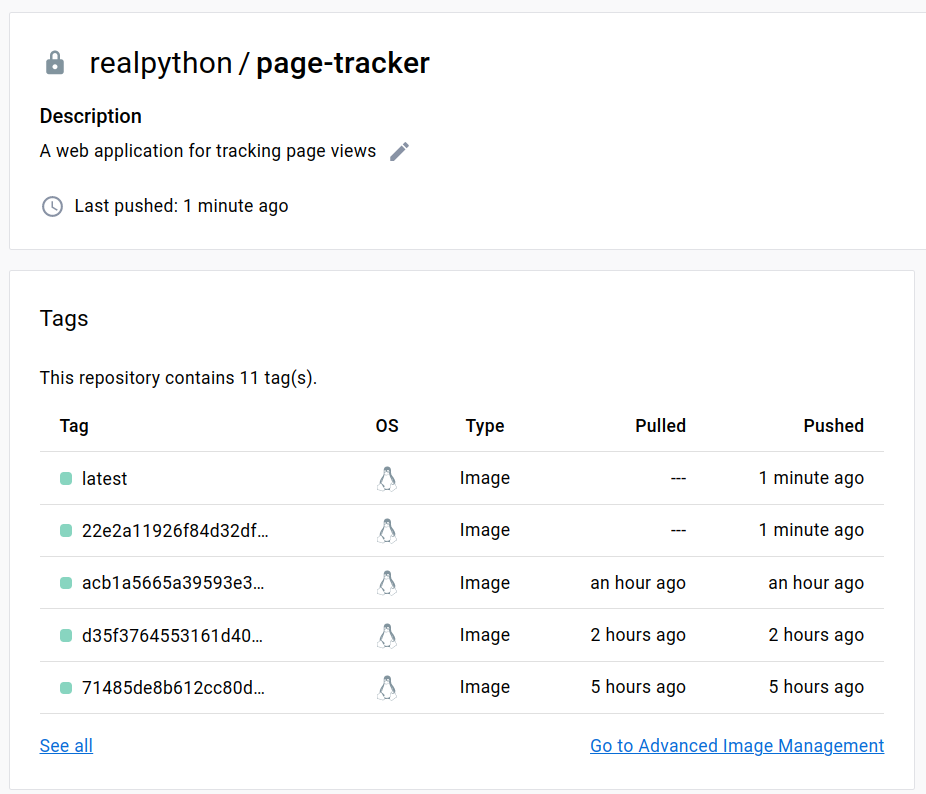
Each time the CI workflow succeeds, the pushed Docker image gets tagged with the current Git commit hash and the label latest.
Congratulations! That concludes the entire tutorial on building a continuous integration pipeline with Docker and friends. Give yourself a well-deserved pat on the back because it was no easy feat!
Next Steps
There’s always so much more that you can do to improve and fine-tune your existing continuous integration process. Even though this has been a thorough and hands-on tutorial on building a robust CI pipeline, you barely scratched the surface!
Here are a few ideas for you to consider:
- Automate deployment to the cloud for continuous delivery.
- Move toward continuous deployment with full process automation.
- Introduce a load balancer and replicas of your services for better scalability.
- Secure sensitive data stores with an authentication token.
- Configure persistent logging and monitoring of your services.
- Implement blue-green deployments for zero downtime.
- Add feature toggles to experiment with canary releases and A/B testing.
With this tutorial, you’ve gotten a good foundation to start from. You can certainly take it from here to build a fully automated and production-ready continuous integration system that harnesses the power of Docker and friends.
Conclusion
You now have a solid understanding of how to build, deploy, and manage multi-container web applications in a containerized environment. You covered the development, testing, securing, dockerizing, and orchestrating of a Flask web application hooked to a Redis server. You also saw how to define a continuous integration pipeline using Docker, GitHub Actions, and various other tools.
In this tutorial, you’ve:
- Run a Redis server locally in a Docker container
- Dockerized a Python web application written in Flask
- Built Docker images and pushed them to the Docker Hub registry
- Orchestrated multi-container applications with Docker Compose
- Replicated a production-like infrastructure anywhere
- Defined a continuous integration workflow using GitHub Actions
Are you ready to build your own continuous integration pipeline? Let everyone know in the comments!
Free Download: Click here to download your Flask application and related resources so you can define a continuous integration pipeline with Docker.