Julius AI
Julius AI is a conversational data analysis workspace from Julius, a San Francisco AI lab, that answers plain-language questions about uploaded files and connected databases by writing and running its own analysis code.
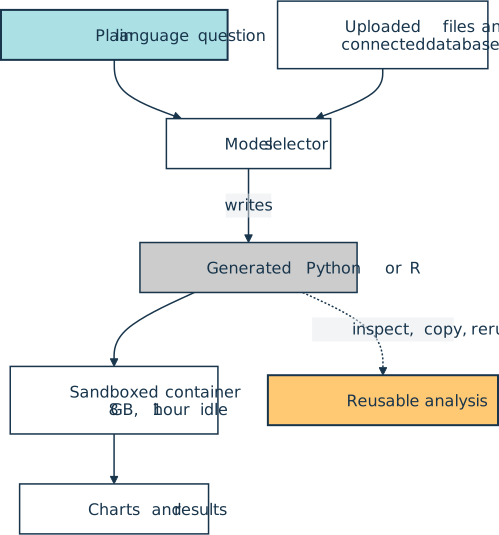
Julius generates Python or R and executes it in a sandboxed cloud container, so a request to correlate ad spend against revenue turns into a script that users can inspect, copy, and rerun. Charts come from ordinary Python plotting libraries such as matplotlib, seaborn, and plotly.
Containers hold 8 GB of RAM by default and expire after an hour of inactivity, with more memory and longer lifespans on higher tiers. A model selector switches the reasoning layer between the in-house Julius 1.2 family, tuned for data work, and general models from OpenAI, Anthropic, and others. Those pieces line up into a single path from question to answer:
Data connectors on business plans wire the workspace straight into Postgres, Snowflake, BigQuery, and similar sources, so analysis runs without exporting files first.
Rahul Sonwalkar founded the company in 2022 after going through Y Combinator, and it raised a $10 million seed round led by Bessemer Venture Partners in 2025. The product has widened past analysis into presentations, reports, websites, and generated media. Julius is hosted only, with a free tier and paid plans above it, and its Notebooks feature was retired in August 2026.
Official website: julius.ai
Related Resources

Tutorial
Python for Data Analysis: A Practical Guide
In this tutorial, you'll learn data analysis with Python by following a structured workflow with pandas, Matplotlib, and scikit-learn.
For additional information on related topics, take a look at the following resources:
- Automate Python Data Analysis With YData Profiling (Tutorial)
- Plot With pandas: Python Data Visualization for Beginners (Tutorial)
- pandas GroupBy: Your Guide to Grouping Data in Python (Tutorial)
- Visualizing Data in Python With Seaborn (Tutorial)
- Interactive Data Visualization in Python With Bokeh (Tutorial)
- Using Python for Data Analysis (Quiz)
- Automating EDA With fg-data-profiling (Course)
- Automate Python Data Analysis With YData Profiling (Quiz)
- Plot With pandas: Python Data Visualization Basics (Course)
- pandas GroupBy: Grouping Real World Data in Python (Course)
- Visualizing Data in Python With Seaborn (Quiz)
- Interactive Data Visualization With Bokeh and Python (Course)
Have a question about this? Mentor AI can show you examples, compare related terms, and point you to tutorials.
Ask Mentor AI

By Martin Breuss • Updated Oct. 7, 2026